
Bitcoin price patterns by themselves are relevant, but many things affect the price. By learning about the variables, we may catch a glimpse of how price is determined.
What are these variables? What is this ecosystem and who are its members?
First, we have miners
Miners are the analogue of photosynthetic life. They are the primary converters of energy into biomass (Bitcoin); therefore, they are the most important link in the cycle. Without miners, there would be no life. Just as plants chain CO2 into carbohydrates, so do miners chain transactions into blocks.
Miners are also the primary consumers of goods paid for with Bitcoin (especially mining equipment). Finally, miners spend Bitcoin on fiat money, which leads us to the second big entity group: traders.
Next, we have traders
Traders regulate the cycle between Bitcoin and fiat, while trying to feel the pulse of the price in order to profit from it. Mostly, they gather and eat in big ponds called exchanges, or they roam sparse communities of consumers as independent brokers, selling or buying Bitcoin at a markup.
Then there are merchants
Merchants need traders in order to get the fiat needed to survive. The magic of Bitcoin is that these are all roles, and one person can be a miner, trader and merchant all by him- or herself. Yet these roles hold an intricate relationship that determines price.
For instance, much is said about price when a big merchant adopts Bitcoin as a form of payment. The most common reaction is hype, a type of market manipulation that we see in the all too common phrase “to the moon!” The logic of this expression is simple, but short-sighted. As more people adopt Bitcoin, there will be more demand for it, and its price will be increasing.
Yet the opposite is likely to happen. A big merchant needs to eat lots of fiat to survive, and when it acquires lots of bitcoin, it needs to sell it. Thus, the supply of tradable bitcoin increases, lowering its market price. However, not all bitcoin-possessing entities share the same urgency to trade them. There’s another group of relevant sub-entities in this ecosystem: hoarders.
We also have the hoarders
Hoarders believe that one magical day, each bitcoin is going to be worth millions, and they cling to them in greed, postponing a current meal for a future feast. Since there is a limited amount of bitcoin, this makes sense. Two questions remain: For how long will they hold them? And how many do they have?
While we can sort of figure out the former, we can surely find out the latter by analyzing the blockchain. It turns out the busy squirrels have many bitcoins. According to previous studies, between 55% and 73% of all bitcoins are dormant in the blockchain. This percentage is really high.
Take for instance the total amount of money available in the world, which comes to about US$75 trillion (short-scale). If $100 bills were laid out on the floor side by side, they would make a carpet totaling about 775,421 square kilometers. If we say that about 64% of that money is dormant, then we would have enough sleeping cash to cover the surface of Spain, and the rest could easily cover New Zealand.
Currently, the Bitcoin market capitalization is about 3.5 billion US dollars. Compared to the US$75 trillion dollar “market cap,” this would create a carpet of a meager 36.18 square kilometers.
If Bitcoin takes off, it is understandable that hoarders would speculate about someday getting a sizeable mileage (pun intended) out of their small square of coins.
It is very difficult to predict when hoarders will spend their bitcoins. However, we know that some of these sleeping coins will never wake up. We all know people who have either sent to an inaccessible address (intentionally or not), or who have lost their keys.
Finally we have consumers
Consumers simply spend coin to buy goods or services. Whether they acquired them through mining or trading is another business.
Now that we have the major members of this simplified ecosystem, let’s lightly define their relationships.
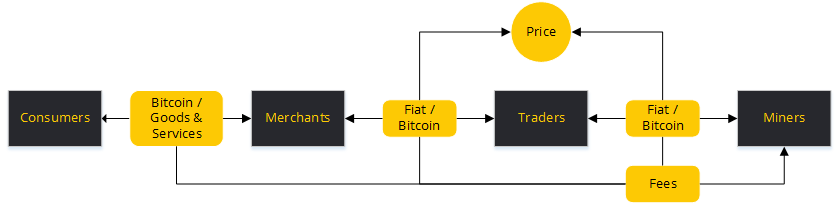
You may notice that there are no hoarders in first simple diagram. That’s because I consider hoarding to be a form of speculation. They represent the extreme end of a long selling position.
This would not be a full picture of the ecosystem if it didn’t include its interactions with the rest of the world. Variables such as cost of electricity particularly affect miners, as a surge in the price of electricity can easily wipe out those who are less efficient.

Now, let’s feed some hypothetical bitcoin to this system to see how it works.
To begin with, miners have been busy and profitable, so their mining efficiency could be calculated at a realistic 50%. That means that for every dollar spent on electricity, they make about 50 cents. Each month they “mint” 108K coins, for which they pay US$18 million in operational costs. Let’s assume their current monthly earnings are US$9 million, of which they constantly reinvest half just to stay afloat. They exchange 25% into fiat money, and they hoard the remaining 25 “just in case.”
Traders have also been happy. The exchange rate is currently US$250, and on the whole their working capital is 250K coins. The winning traders in the market are experiencing a 10% monthly increase in capital. Their operating cost is a meager 1% of their working capital. They keep half of their earnings as working capital, and the other half they keep for themselves. All of their capital is in dollars, and they take positions in bitcoin only temporarily.
The scene is idyllic and merchants are prosperous, with a selling volume of 25K coins each month. Most of them really enjoy this Bitcoin thing, but they don’t have enough trust in its stability to hold them for long periods of time. So they exchange their entire earnings for fiat money. However, a few big merchants have enough faith to keep a whopping 10% in bitcoin. It’s not much, but it amounts to 1% of the selling volume.
The network is processing about 20K transactions per month, netting a mere 2 bitcoins to the miners as fees.
Due to merchant discounts offered to consumers when they pay in cryptocurrency, and to the conveniences of Bitcoin, many consumers buy bitcoin for everyday use. Their buying volume equals 16K coins, of which they spend 93.75% with merchants. The other 6.25% is hoarded for some unknown reason. (Greed perhaps?)
Now the previous diagram becomes some sort of matrix.
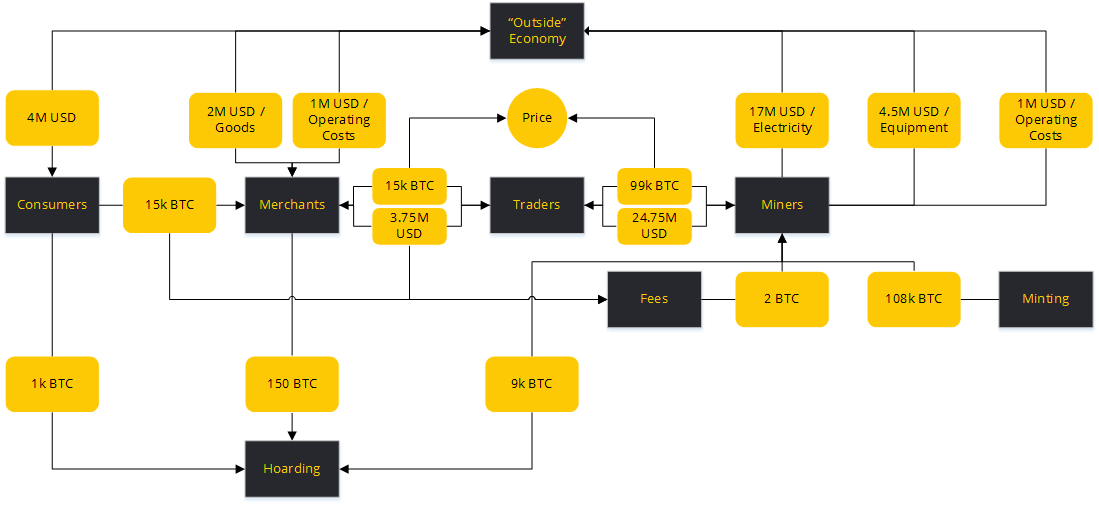
This “ecosystem” diagram is far from perfect, but it shows us something important: that Bitcoin creates jobs.
All these made up numbers provide enough cohesion to paint a snapshot of how fiat and bitcoin move. With enough time and resources, a much more precise version could be created. I haven’t debugged this yet, so feel free to destroy it in whatever fashion you prefer. This simplistic model can be only rebuilt better.
Personally, I’ve got so much more to say about this particular view, but let it be enough to say that each node in this graph is incredibly complex in its own right, and amenable to the psychological interactions of its members. This is only a simplified, birds-eye view of the whole affair. I hope it helps.
Did you enjoy this article? You may also be interested in reading these ones: