The views and opinions expressed here are solely those of authors/contributors and do not necessarily reflect the views of Cointelegraph.com. Every investment and trading move involves risk, you should conduct your own research when making a decision.
Even after the massive correction last week, Bitcoin is likely to end 2017 with huge gains. However, the big question is whether Bitcoin can continue its scintillating run in 2018. While there is no definite answer, most believe that the current correction is a buying opportunity as the bull run is likely to extend next year.
Cryptocurrency Entrepreneur Julian Hosp expects Bitcoin to reach $60,000 next year, but he also sees the cryptocurrency falling to $5,000 in 2018. The problem is that he is not sure, which level will be reached first. Hopefully, we will be able to forecast the movements for our readers.
While the cryptocurrency enthusiasts are working towards integrating them into mainstream activities, the regulators are creating various obstacles. This is likely to escalate in 2018.
However, as traders, we try to profit from every possible situation and cryptocurrency movement. So, after souring the Christmas celebrations, will Bitcoin give the investors an opportunity to cheer the New Year?
Let’s find out.
BTC/USD
According to our expectation, the aggressive bulls bought the dips to the 50-day SMA. After three days of volatile trading, the cryptocurrency is attempting to resume its uptrend today.
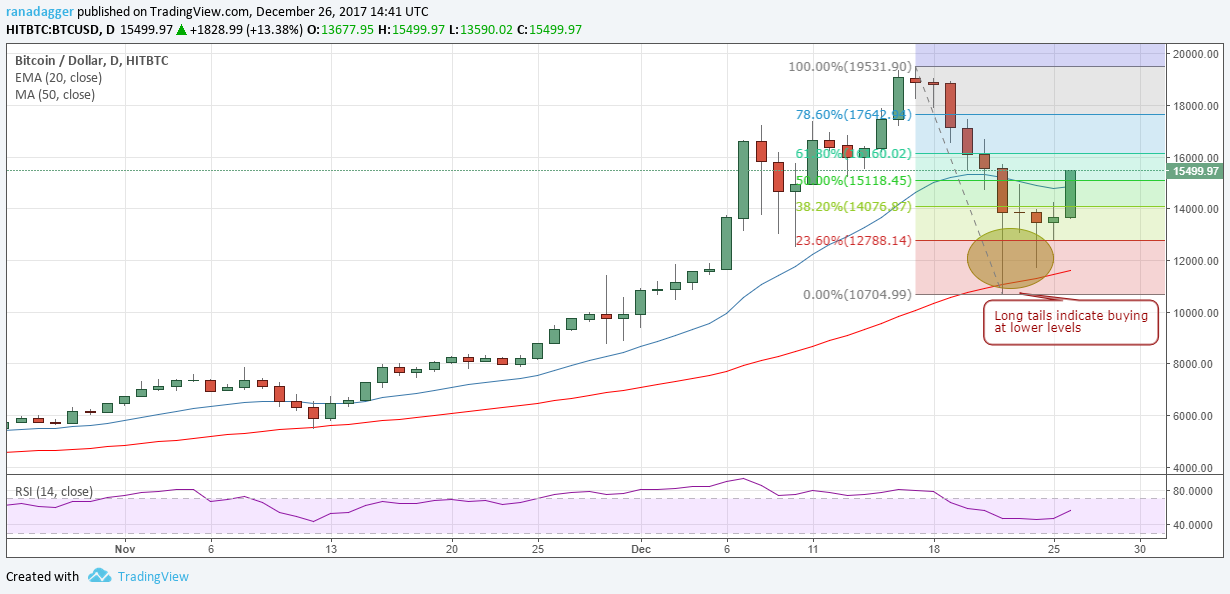
On Dec. 22 and Dec. 24, the bulls aggressively bought the dips between $13,000 and $11,000 levels, which resulted in the formation of long tails on the candlesticks.
So, for now, $11,000 is likely to act as a short-term bottom. However, will the BTC/USD pair rally back to the highs?
Unlikely?
The pullback is likely to face resistance in the zone between $15,118.45 and $16,160.02, which are 50 percent and 61.8 percent Fibonacci retracements. From this resistance zone, we expect a dip back towards the recent lows.
The next fall towards the $11,000 level will give us a better idea of the uptrend.
Nevertheless, all throughout 2017, Bitcoin has always surprised us by rallying to new highs after every dip. Therefore, if the price breaks out of $16,160.02 levels, chances are that it will retest the highs. However, we think there are low chances of that happening.
ETH/USD
Though we expected Ethereum to find support at the $500 mark, the strong pullback surprised us. Since the past three days, the cryptocurrency is attempting to resume its uptrend.

It has broken out of the 61.8 percent Fibonacci retracement of the recent fall. There is a minor resistance at $787.89, above which a retest of the highs is possible.
Our bullish view will be invalidated if the ETH/USD pair falls and sustains below $650.
BCH/USD
In our previous analysis, we had said that Bitcoin Cash would find support at the $1,785 levels and that is what happened. However, we had not expected such a sharp pullback; hence, we did not recommend a buy.

After the plunge on Dec. 22, the cryptocurrency has entered into a small range. It is facing selling around the $3,200 mark, whereas, it is gaining support close to the $2,300 levels.
The intraday range has shrunk since yesterday. Within a couple of days, we believe there’ll be a large range move. If the BCH/USD pair breaks out of $3,200, we expect it to retest the highs once again, with a small resistance around the $3,650 levels. If, however, the digital currency breaks down of $2,300, a fall to $1,600 is likely.
XRP/USD
Ripple plunged on Dec. 22, but it found strong support at $0.67. From there, it rallied 57 percent to close at $1.05398. This confirms a strong underlying demand for it.
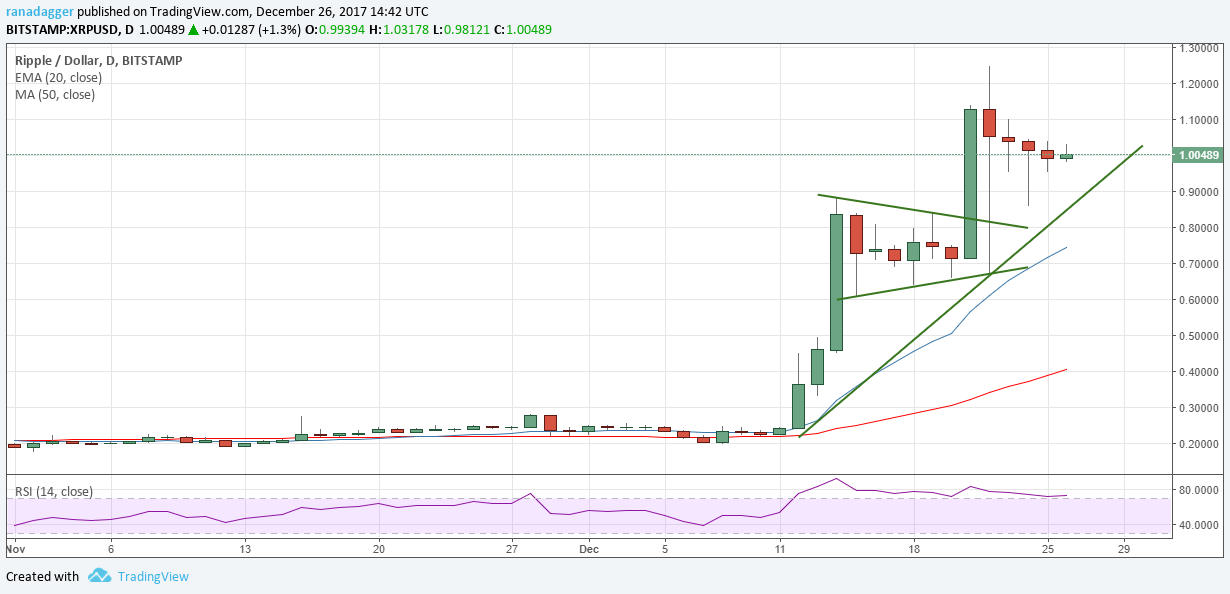
The XRP/USD pair has been consolidating for the past three days. Within the next couple of days, we expect the cryptocurrency to attempt to move up. The chart pattern suggests another leg up, which should carry it to new lifetime highs of $1.5.
Our bullish view will be invalidated if Ripple falls below the trendline support.
IOTA/USD
IOTA has remained within the range of $3.032 on the lower end and $5.59 on the upper end since Dec. 6. Attempts to sustain below the supports of the range failed.
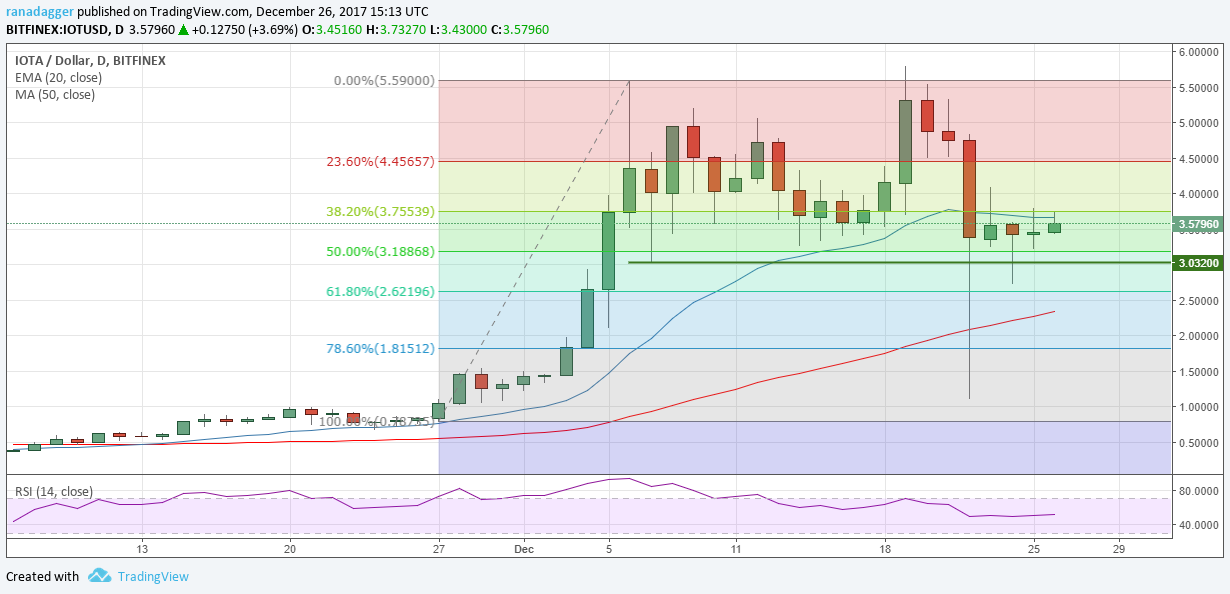
The dips below the range saw strong buying, both on Dec. 22 and Dec. 24.
As the breakdown of the range failed, we expect the bulls to push the cryptocurrency towards the upper end of the range at $5.59. Our bullish view will be proven wrong if the IOT/USD pair falls and sustains below $3.032 levels.
LTC/USD
While Litecoin dipped below the support levels of $240 on Dec. 2, it quickly recovered and closed above this level.
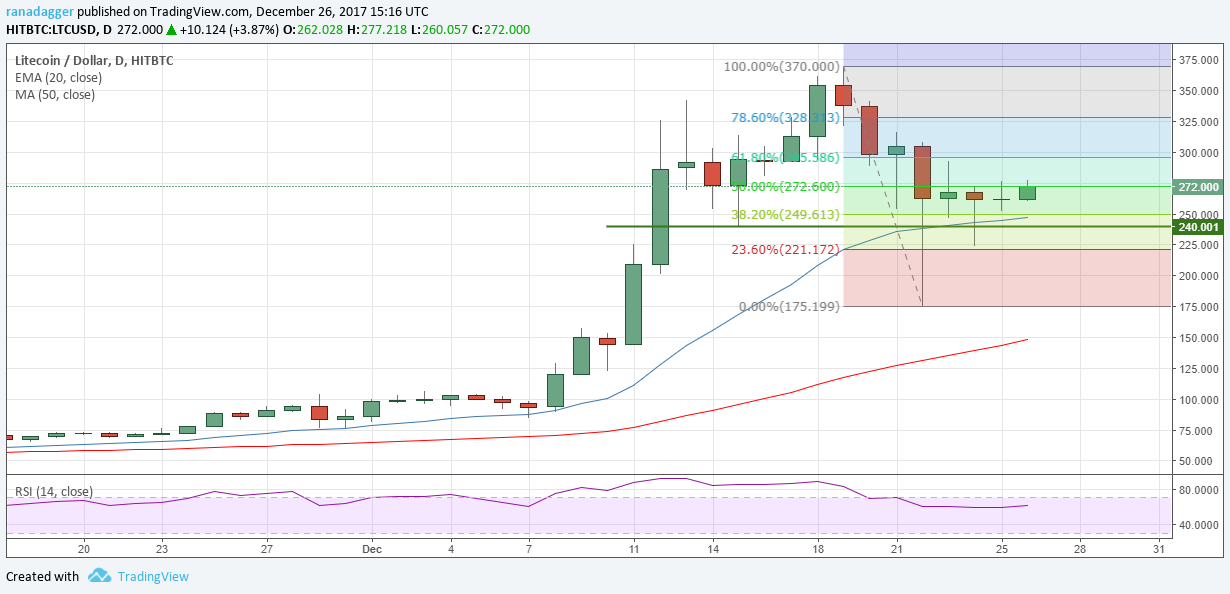
It is currently facing resistance around the 50 percent Fibonacci retracement levels of $272.6. We anticipate selling in the zone of $272.60 and $292.589.
However, if it breaks out of $300, we can expect a retest of the highs.
On the other hand, failure of breakout above $300 will keep the LTC/USD pair range-bound between $240 and $300.
DASH/USD
The fall on Dec. 22 found support close to the 78.6 percent retracement levels. On Dec. 24, the 20-day EMA acted as a strong support.
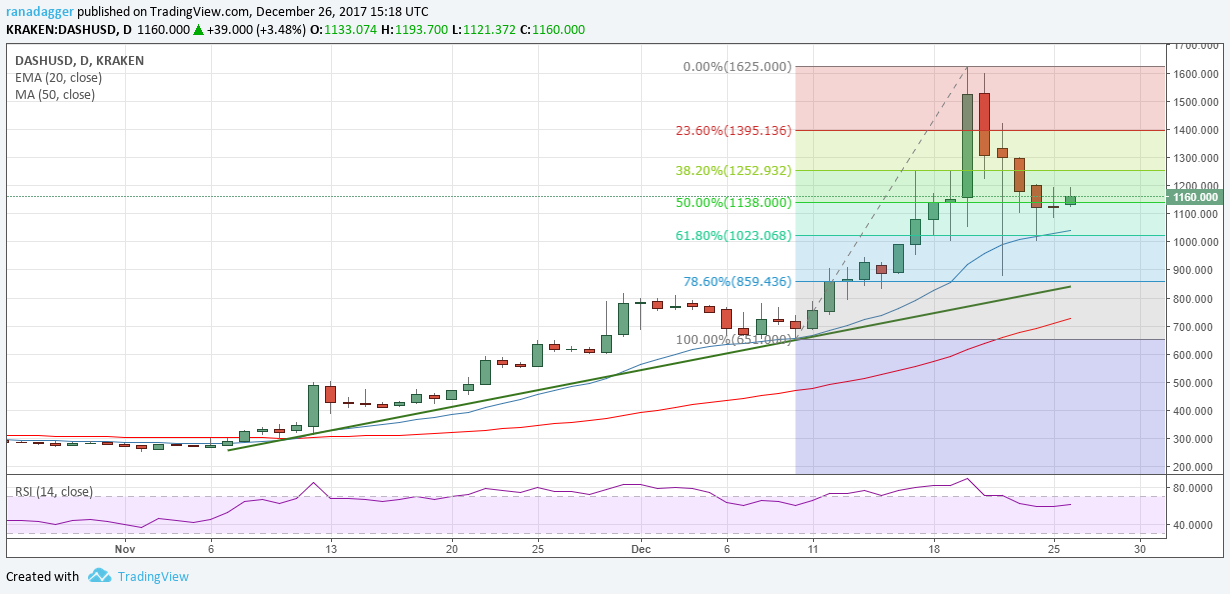
For the past two days, the cryptocurrency has been facing resistance at the $1,200 mark. If the bulls manage to break out and sustain above this overhead resistance, we expect a move to $1,338.50, which is the 61.8 percent Fibonacci retracement of the recent fall.
Above this, a retest of the highs is likely.
The DASH/USD pair will become negative if it declines below $1,000 levels.
We expect volatile trading due to the holiday season. We believe that the cryptocurrencies markets will make a decisive move next week onwards when the traders return back to work. So, please keep the allocation sizes small until then.
*The market data is provided by TradingView.
