The views and opinions expressed here are solely those of authors/contributors and do not necessarily reflect the views of Cointelegraph.com. Every investment and trading move involves risk, you should conduct your own research when making a decision.
The cryptocurrency mania can be gauged from the fact that Bitcoin, with its 1300 percent plus gains, doesn’t find a place among the top 10 best performing cryptocurrencies of 2017. The top performer was Ripple, with more than astounding 30,000 percent increase over a year.
In comparison, the traditional investors consider themselves lucky if they outperform the S&P 500, which rallied 20 percent last year.
While no one can predict what will happen in 2018, one thing is certain; if the traders can spot the setups, they can reap a rich reward.
As we already saw both cryptocurrencies rallying collectively and them going separate ways, it might be a good idea to diversify your portfolio with more than one cryptocurrency.
Our attempt should be to trade the best setups that can offer us the maximum profits with the minimum risk.
So, let’s find out the probable candidates to buy this week.
BTC/USD
Bitcoin is finding strong buying support at the 50-day SMA; but, unlike before, it is not able to pullback with strength. The bears are strongly defending the $14,000 levels. The daily range has been shrinking for the past two days.
On Dec. 30, though the BTC/USD pair broke below the neckline of the bearish head and shoulders pattern, it could not break below the 50-day SMA. It quickly climbed back above the neckline on the next day.
The bulls are finding it difficult to break out of the overhead resistance from the down trendline and the 20-day EMA; and we don’t find any buy setup between $12,000 and $14,000.
Still, Bitcoin is likely to rally to $16,000, once the cryptocurrency breaks out of the down trendline. On the other hand, if it breaks down of $12,000, it can retest the lows made on Dec. 22.
We expect a large range move within the next couple of days.
ETH/USD
We had mentioned that the digital currency will gain strength once it breaks out and closes above the downtrend line and that is what happened.
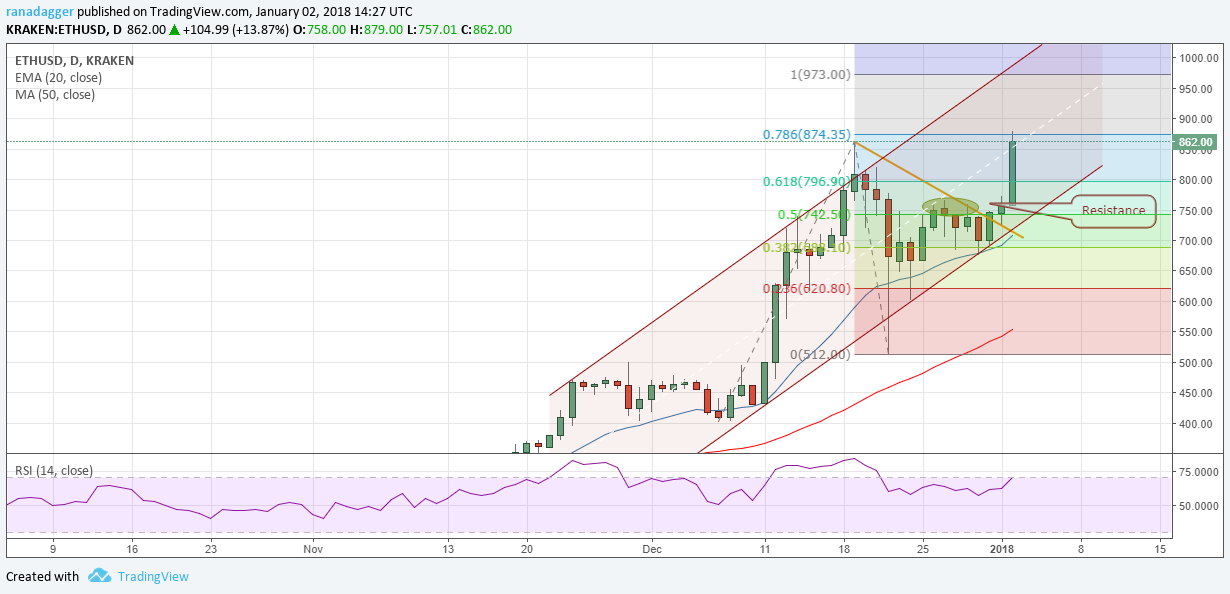
The ETH/USD pair broke out of the downtrend line on December 31 and crossed the overhead resistance of $760 on January 01. Thereafter, it picked up momentum and has created a new lifetime high today.
If the bulls manage to sustain above $863, we can expect a rally to $973 levels, which is the next Fibonacci extension target. The resistance line of the ascending channel is also at this level. Therefore, we expect this level to offer a strong resistance.
On the downside, if the bulls fail to sustain above $863, the trendline of the channel close to the $760 mark, will act as a strong support.
BCH/USD
We expected Bitcoin Cash to plunge to the 50-day SMA, once it broke below the $2,300 mark. Instead, it took support at the trendline and is attempting a recovery.
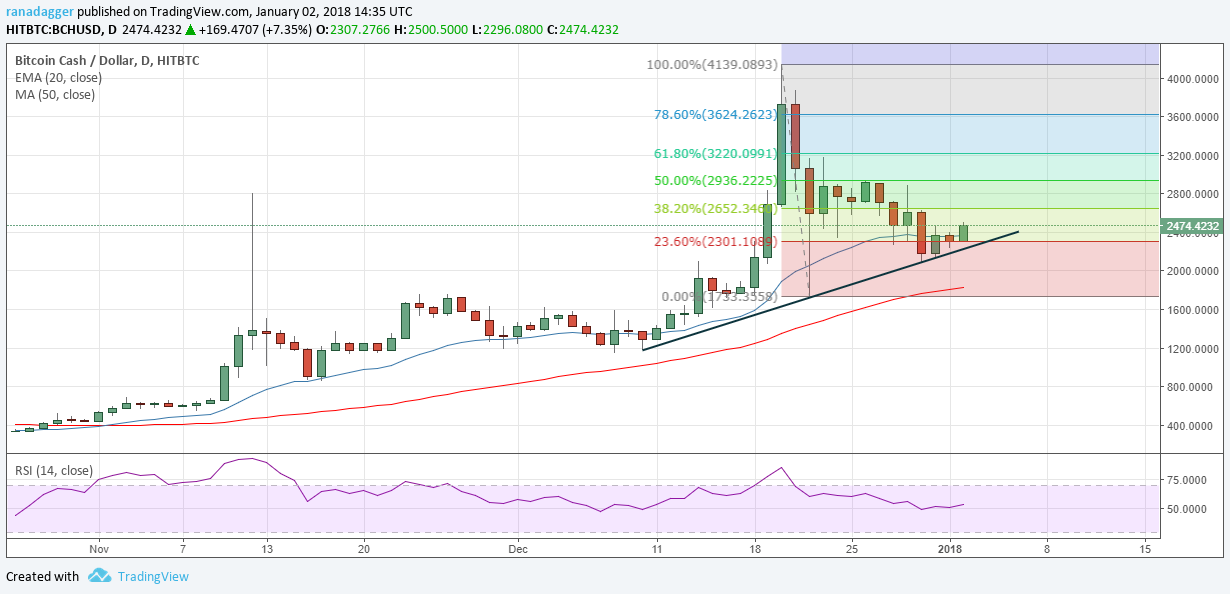
If the BCH/USD pair sustains above $2,475, it should attempt a rally to $2,900 levels, which is a major resistance.
Any fall is likely to be supported at the trendline and if it breaks, the next support is at $2,072. However, the risk to reward ratio is not attractive, hence, we don’t recommend any trade on it right now.
XRP/USD
The correction in Ripple was short lived as the buyers jumped in at the $1.61 mark; it shows strength.
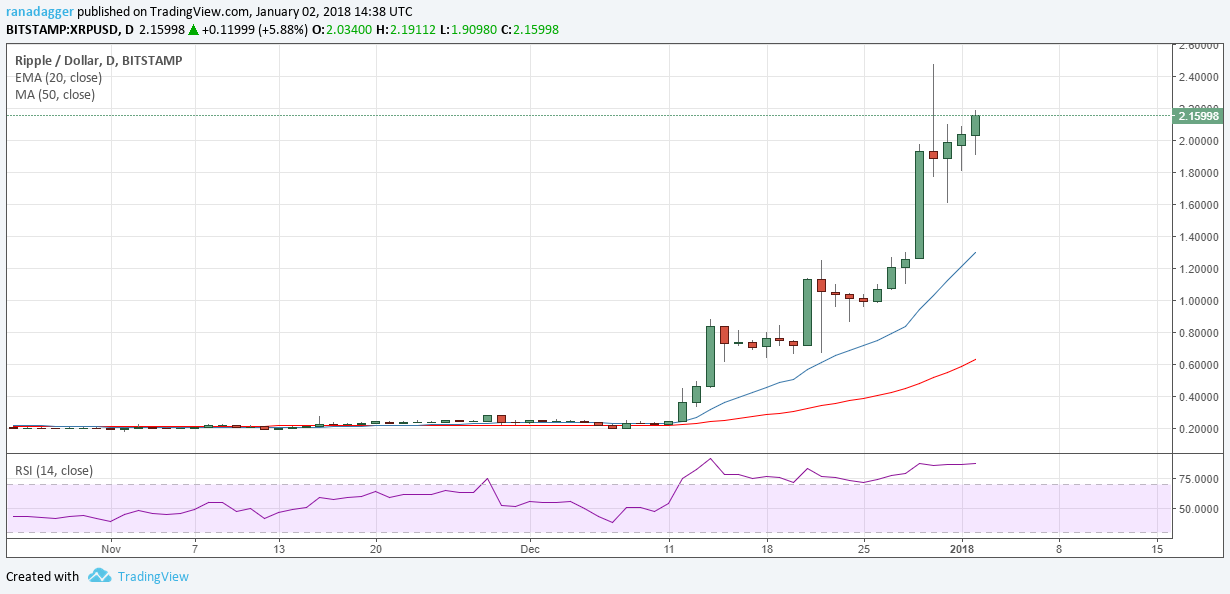
For the past two days, the XRP/USD pair had been facing resistance at the $2.1 mark. Today, the bulls broke out of the resistance, which can push the pair to $2.474 levels.
We already saw the cryptocurrency consolidating for six to seven days, before resuming its uptrend. Thus, we anticipate a few more days of consolidation before the price breaks out to new lifetime highs.
On the downside, $1.8 and $1.6 are the two critical support levels. The momentum loses strength only when it breaks down to $1.6.
IOTA/USD
We had indicated in our previous analysis that long positions can be initiated on a breakout and close above the downtrend line.
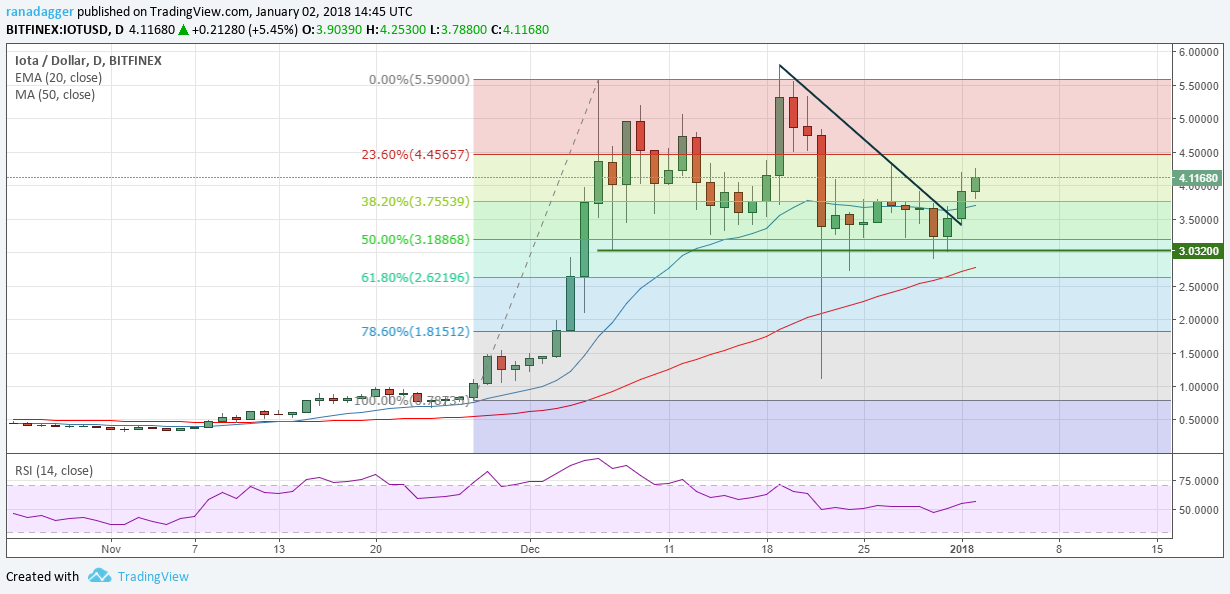
As the bears were unable to sustain below the critical support level of $3.032 for the past few days, chances are that the bulls will attempt to push the price towards the upper end of the range at $5.59.
Therefore, traders who haven’t initiated a long position yet can still do at the current levels of $4.121, with a stop loss of $2.85. We are aiming to trade the large range by buying close to the support and selling at the resistance. We await IOTA/USD pair to be volatile but with a positive bias.
LTC/USD
The bears had the upper hand on Dec. 30, with a break of the neckline of the head and shoulders pattern. But the bulls supported Litecoin around the $200 mark.
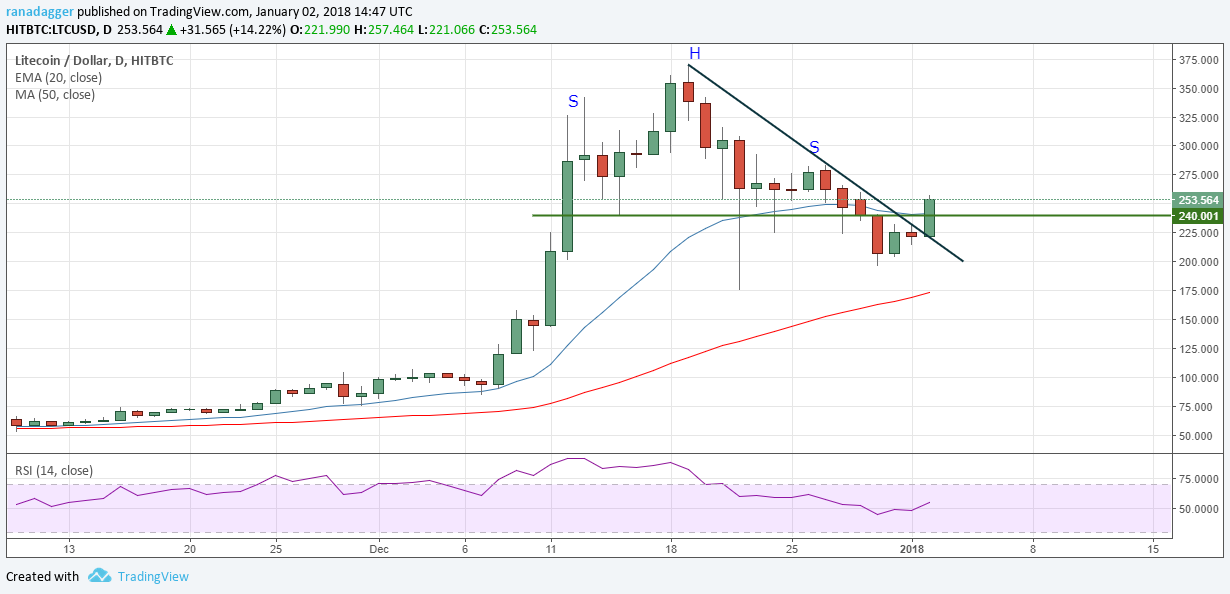
Currently, the LTC/USD pair has broken out of the downtrend line, the neckline and the 20-day EMA. This is a positive move.
Above $250, a move to $283 and thereafter to $300 is likely. On the downside, strong support exists at $200 and below this at $175, from the 50-day SMA.
As this is still a pullback, we don’t suggest a trade on it.
DASH/USD
We expected the trendline support to hold and that is what happened. The cryptocurrency fell to the trendline on Dec. 30. However, the bounce from the support has been impressive.
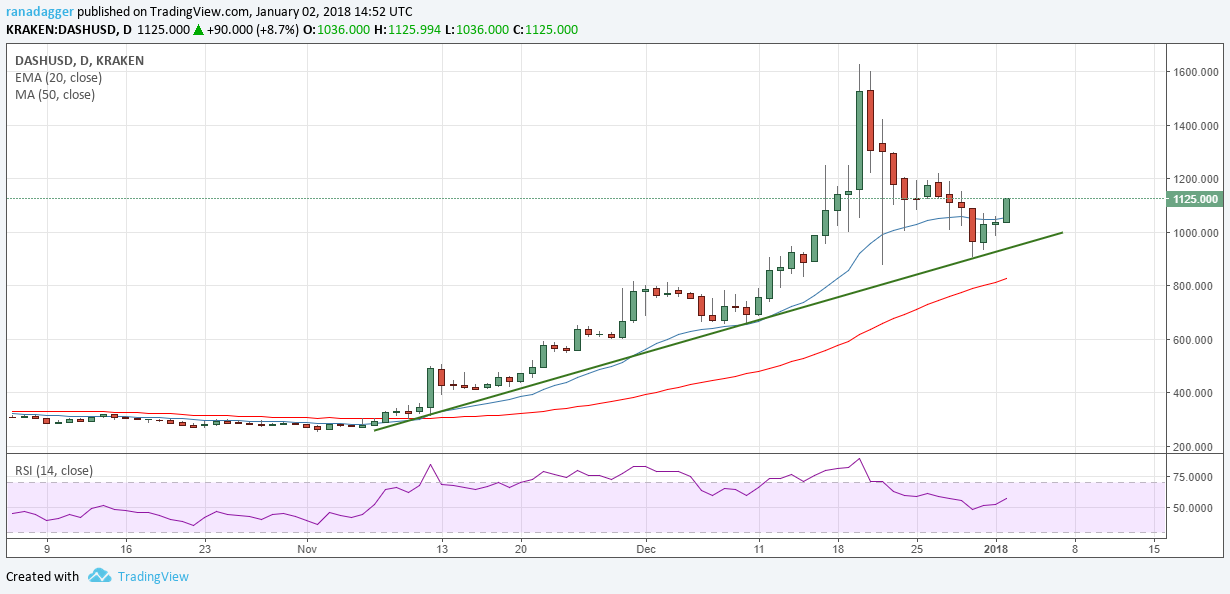
We believe that the DASH/USD pair can now rally to $1,220 levels, where it is likely to face some resistance. On the other hand, any fall will find support at the trendline.
Since the risk to reward ratio does not look good, we are not suggesting any trade.
ADA/USD
Cardano remained in a range from Oct. 01 to Nov. 25. Thereafter, it rallied for four days and again became range-bound until Dec. 14. It then spiked again in the next five days from $0.135375 to $0.581983. Subsequently, it entered into a correction, which ended around the $0.37 levels.
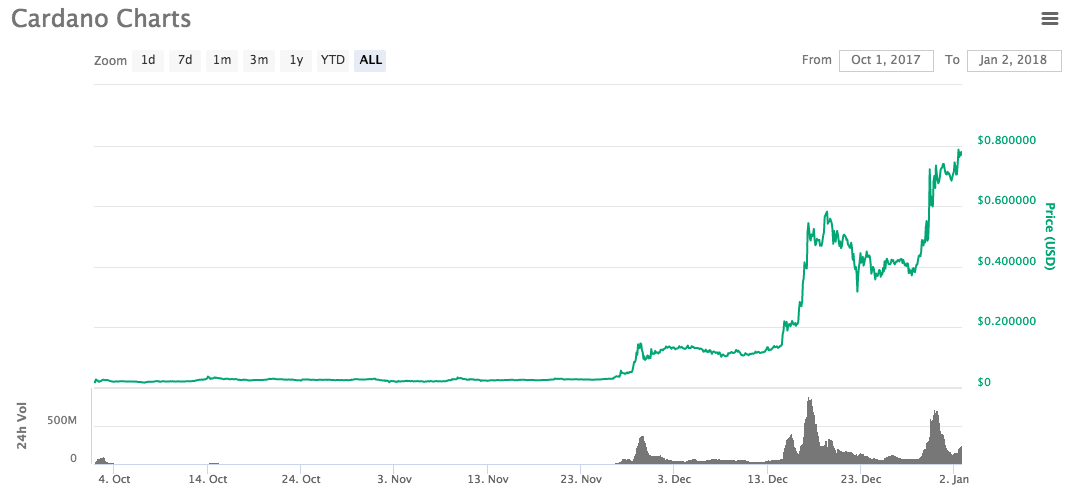
The latest leg of the up move started on Dec. 28 and it has crossed its first target objective of $0.75. The previous rallies lasted for around four to five days. Hence, we anticipate a pullback around the current levels, which should be a good buying opportunity, as the cryptocurrency remains in a strong uptrend.
Any pullback should find strong support at $0.68 and $0.60 levels.
The market data is provided by TradingView.
