For timely updates on price updates, follow me @sammantic.
BTC price at press time: US$248.00
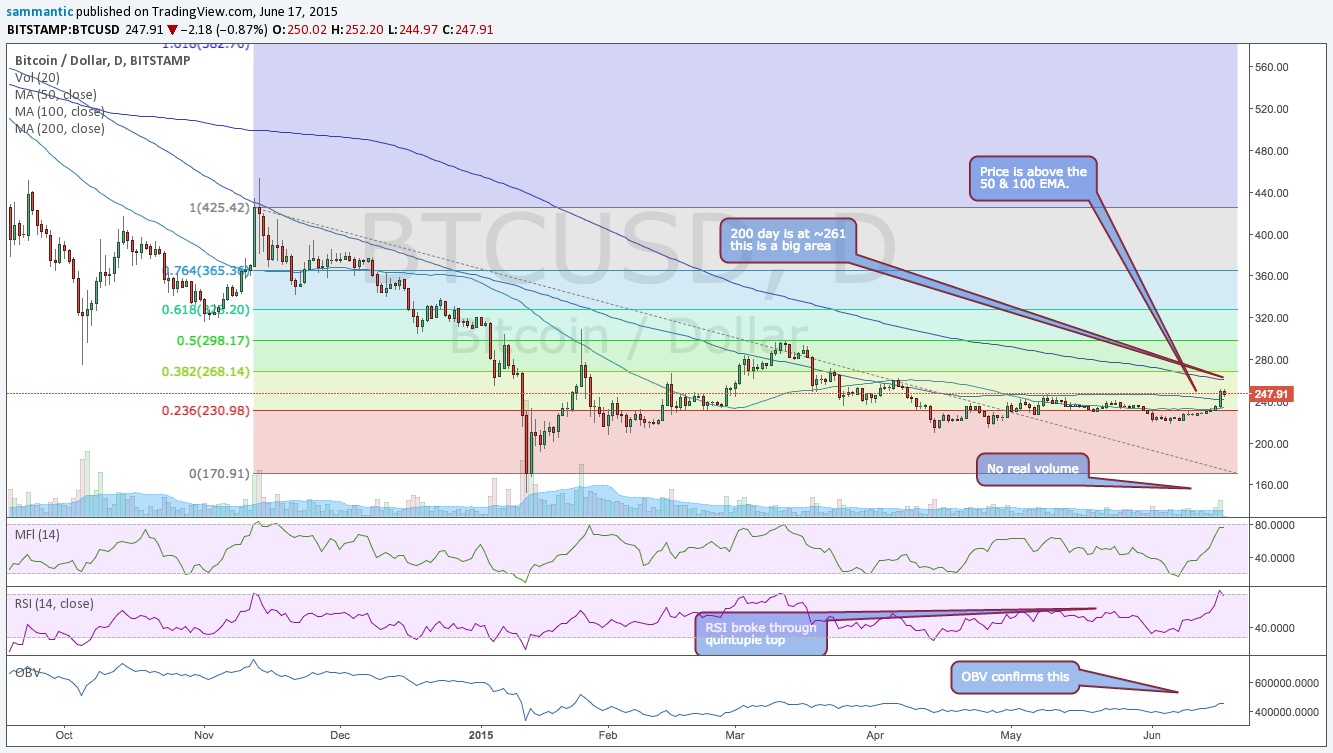
Bitcoin has finally broken above the noted 50 day Exponential Moving Average (EMA) at US$233 and done so with force. It now also sits above the 100 day EMA (~US$241) as well. It’s possible a change of trend could be underway, but it is still too early to tell.
This move has been made on very small volume and On Balance Volume confirms this. If the trend is truly going to change, volume should ideally come in.
The tell tale sign might be seeing volume come in if the price tries to break above the 200 day EMA (~US$261). A general principle and one that should be observed is that volume precedes price. However, the bitcoin exchange market has become very illiquid so price can be pushed up quite easily, which is why continued caution is recommended.
Price holding above the 50 & 100 day for a few days and old resistance becoming support could mean the trend is changing. The Money Flow Index and the Relative Strength Index are now both overbought on the daily chart and price should pull back. Expect a test of the 100 day first at ~US$241.

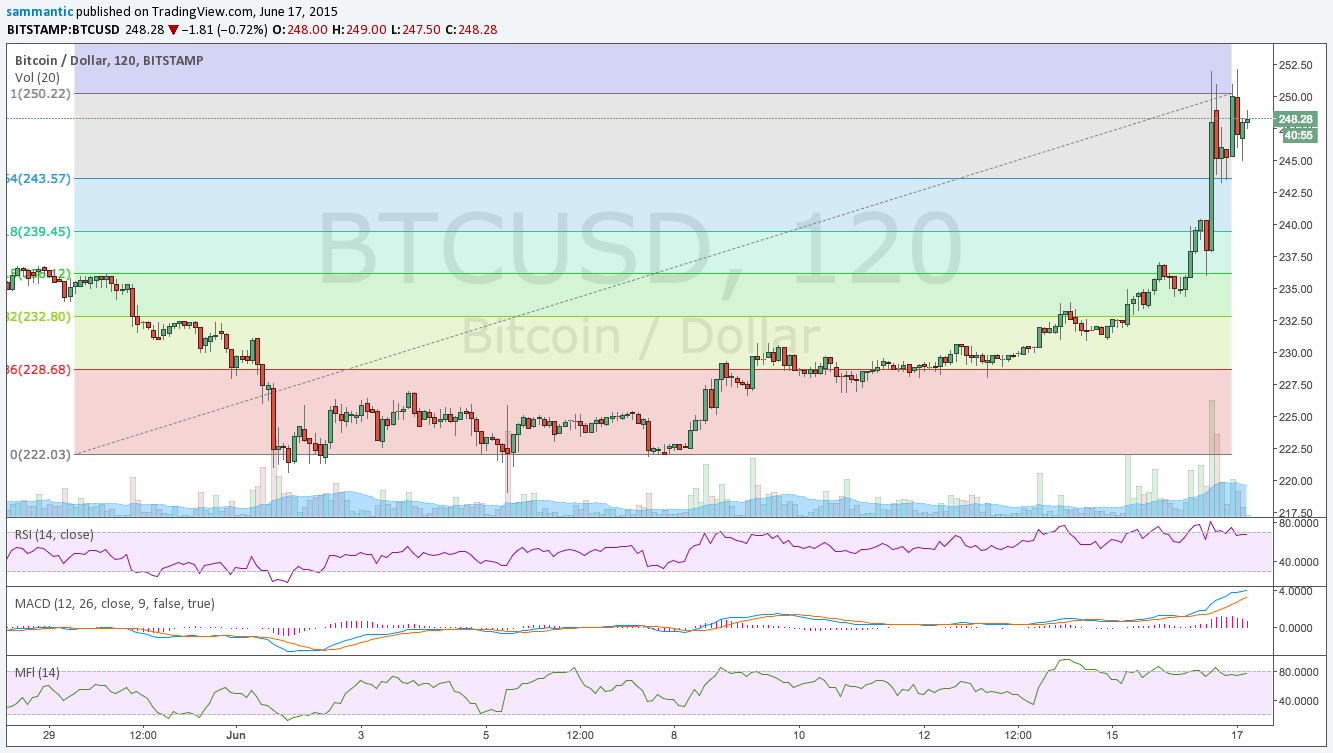
Short term the price is also overbought: the MACD, RSI and MFI are all screaming for a pull back. Based on the Fibonacci retracements - look for it to test that ~US$241 area to start.

This is a positive start to what could possibly be a change in trend. In this area, waiting for price to resolve to the upside or downside is best.
It’s highly likely that a pullback should occur and if it’s a good one - meaning that the price tests it and doesn’t break down - a new trend may indeed be upon us, effectively reversing the current bear market.
Disclaimer: Articles regarding the potential movement in cryptocurrency prices are not to be treated as trading advice. Neither Cointelegraph, nor the author assumes responsibility for any trade losses, as the final decision on trade execution lies with the reader. Always remember that only those in possession of the private keys are in control of the money.
