For timely updates on price updates, follow me @sammantic.
BTC price at press time: US$232.02
Last week’s article began with:
“So far the US$220 support level has held, but price has not been able to move to the upside. It looks like it’s consolidating below that ~US$231 level and has been mentioned before the 50 day estimated moving average, which is now ~US$233. The US$220 mark is now providing support. If this doesn’t hold, then the big support area of ~US$210 better.”
The US$220 held but price continues to consolidate below the 50-day EMA, it made a dash for US$235 but has rejected it and now sits below the 50 day which is at ~US$233.
Long Term
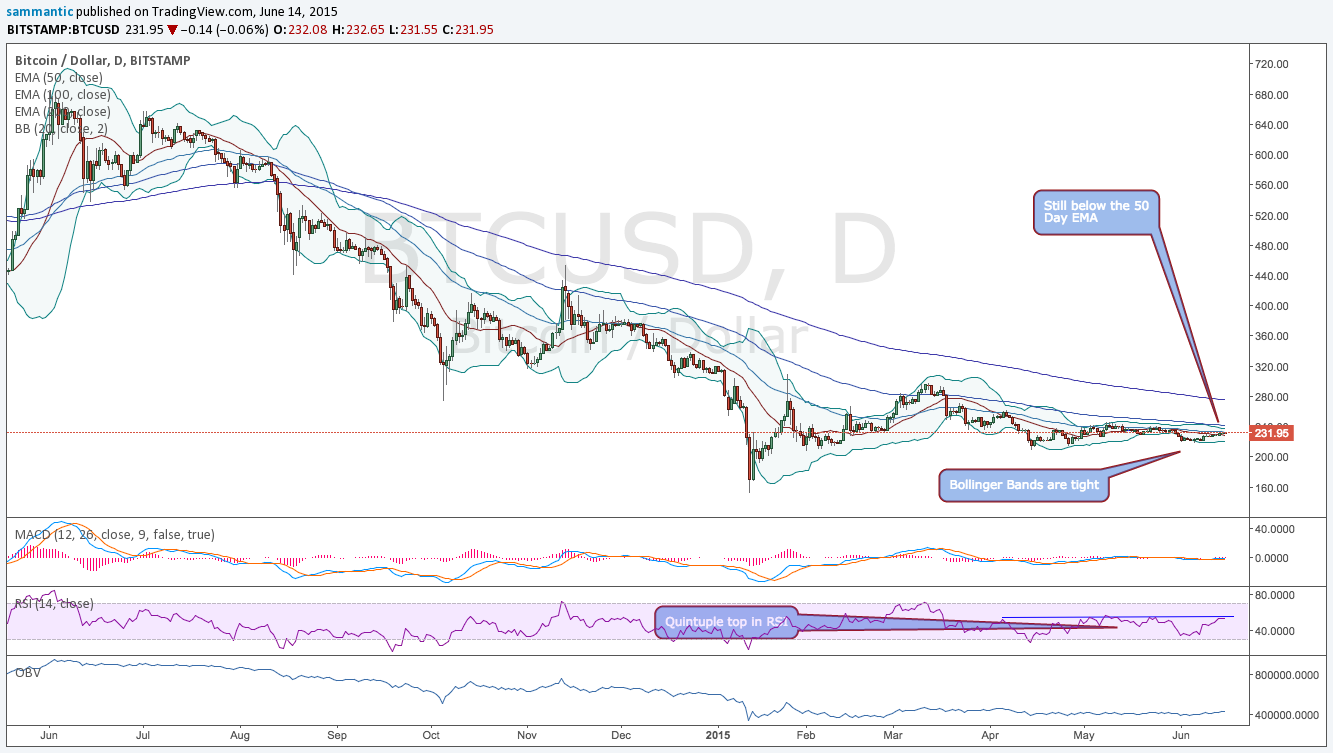
The 1-year (long term) chart for bitcoin has been and remains bearish. The price remains below all three of its EMAs. All three EMAs are tight, particularly the 50 (US ~$233) & 100 (~US$244) days as they continue to compress. The Bollinger Bands are tightening again as price remains right below the 50 day EMA. It looks as though volatility may start picking up soon.
The Relative Strength Index (RSI) appears to have topped out yet again at that 54 level now putting it what looks like a quintuple top. The MACD (moving average convergence divergence) continues to be listless around the zero line. MACD is not signaling a change to the long term trend, as price remains below the 50 day EMA.
On Balance Volume (OBV) has been flat for months and isn’t showing an imminent change of trend as price continues to be in a low volatility and low volume environment. Volume should come in before the next big price move as volume generally precedes price.
A positive step that would show the beginning of a trend change would be for price to get and STAY above the 50 day EMA for more than a few days.

Ichimoku Clouds
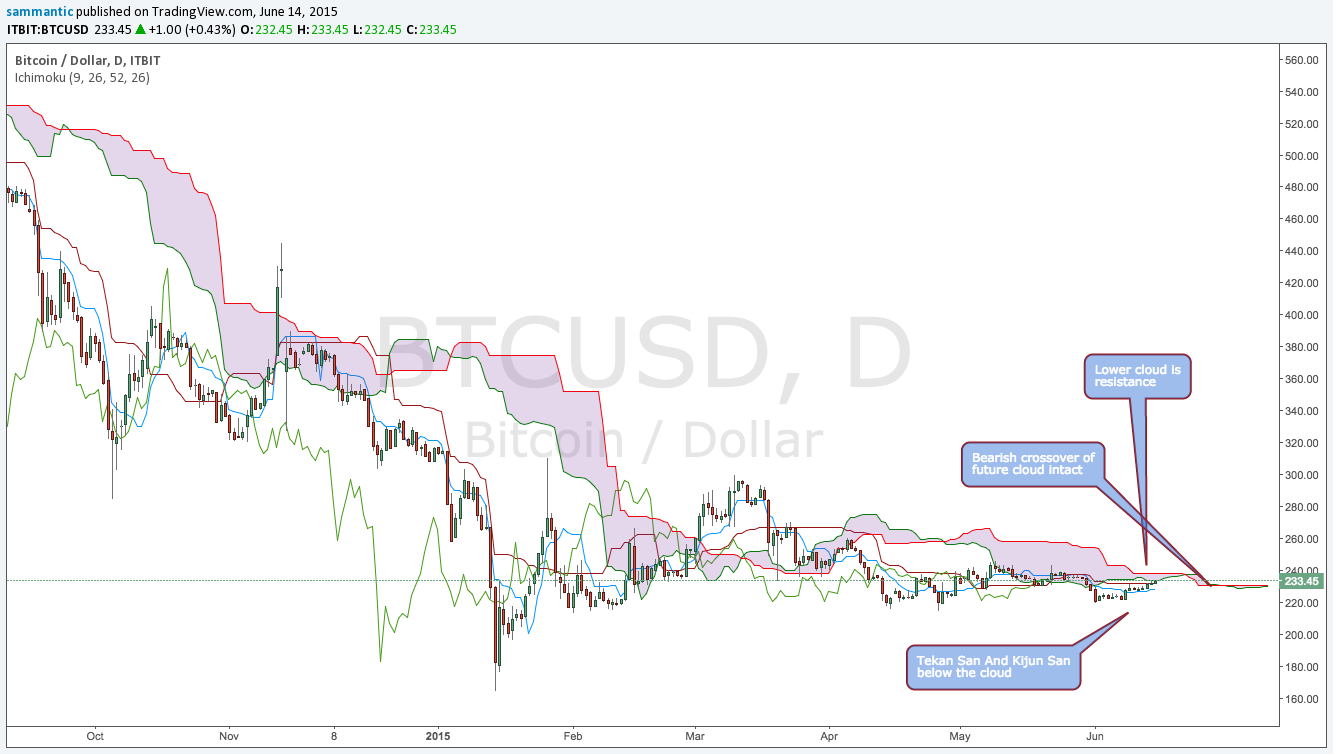
The 1-year Ichimoku (cloud chart) broke out of the cloud below and remains there. Its rejecting entering the cloud at the ~US$233 mark, which is now providing big resistance (the lower bound of the cloud) as its the same level as the 50 day EMA, confirming this area as very important for any hopes of a trend reversal
The cloud ahead continues to be bearish after it crossed over last week. It has flattened out however, and is very compressed. This is causing pressure on the price.
The Tankan Sen (Conversion Line) and the Kijun Sen (Base Line) remains below the lower cloud. This continues to be bearish for price.
For further definitions of what is being discussed, please refer to this previous post on Ichimoku cloud charts.

Intermediate-Term Trend
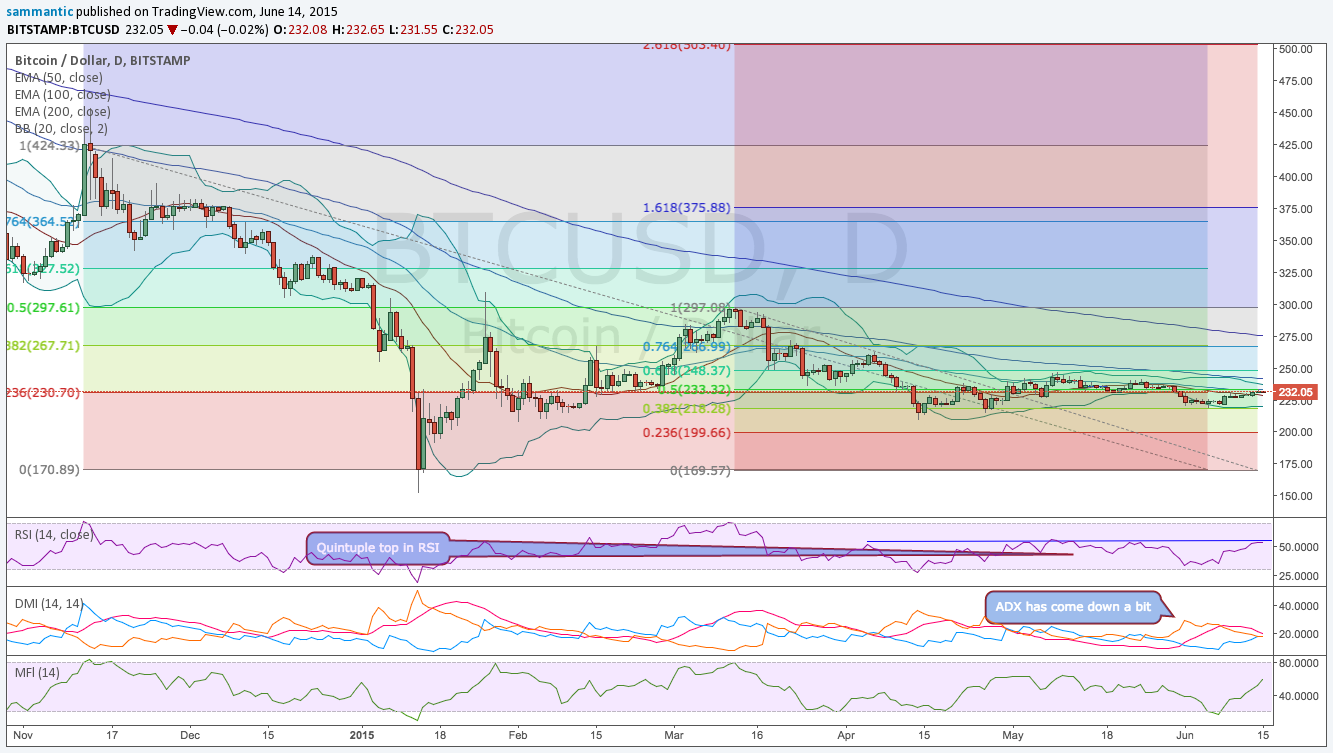
The bitcoin price has reclaimed the ~US230 area from which it broke down last week. Fibonacci retracements have been drawn from 2 price tops: the mid-November high of ~ US$424 and the mid March high of ~ US$298.
Since price reclaimed its support area ~ US$230, it hasn’t been able to get above >5 Fib resistance of ~US$233, which coincides with the 50 day EMA. If price should break below the ~230 area, look for support at ~ US$220. This ~US$219-220 has held so far, but looks poised to be tested again. I still expect a test of major support in the US US$200-210 area. If this doesn’t hold, then price will probably test the lows made in early January.
The RSI shows that quintuple top and continues to stall with every attempt to get above the 50 day EMA. The Money Flow Index has rebounded from oversold territory but looks to be headed into a resistance area.
Included is the Directional Movement Index (DMI), which looks at buying and selling pressures. The blue line indicates buying pressure, the red line indicates selling pressure, and the orange line is the ADX, which indicates the strength or weakness of a trend.
Selling Pressure has fallen since last week, while Buying Pressure has risen. It’s still in a bearish place, though with Selling Pressure above Buying Pressure. The ADX line remains above both the Buying Pressure Line and the Selling Pressure Line but at lower levels then last week. It’s still on a sell signal.
The Bollinger Bands remain tight and a resolution has yet to come although this has been a condition for a while now. It’s still in wait and see mode.

Short-Term Trend
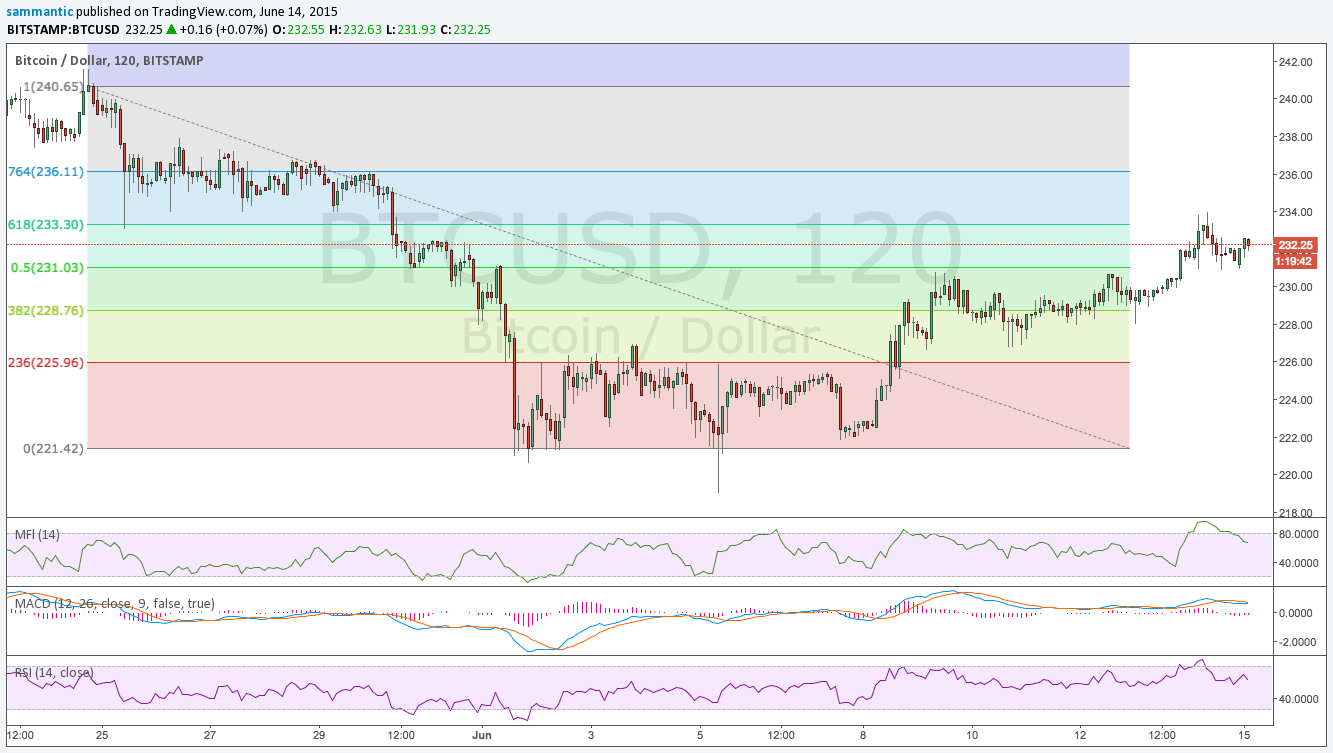
Looking at the short-term trend (May 24 price high of ~US$240) using Fibonacci retracements, the price tried to get above ~US$233 but couldn’t, hitting the US$235 mark and coming back down. All of the short term indicators appear to be peaking out. The first lines of support are ~US$231, US$228 and US$225. Price continues having trouble getting higher.

Still Fighting
Bitcoin’s primary downtrend remains intact and the price has hung in this range for a long time without any resolution. The slow range-bound trading continues without resolution. The price continues to make lower highs though and is heavily entrenched under the 50-day EMA as well as the bottom of the Ichimoku cloud.
A break down in price is still anticipated as long as these conditions continue.
Disclaimer: Articles regarding the potential movement in cryptocurrency prices are not to be treated as trading advice. Neither Cointelegraph, nor the author assumes responsibility for any trade losses, as the final decision on trade execution lies with the reader. Always remember that only those in possession of the private keys are in control of the money.
