
The US Federal Reserve ended QE last week and promised to keep rates “extraordinarily low” for an extended period of time.
Passing the QE torch
However, the great QE rotation has been passed to the Bank of Japan (BOJ) and they answered the call mightily Friday by increasing their bond purchases (QE) by a third. They will not only be buying bonds but stocks and real estate.
Meanwhile, the Japanese pension fund announced it will increase its allocation to domestic and foreign stocks. On the tail end of this, global stock markets roared to the upside and the Japanese stock market (Nikkei) has reached a 7 year high and blasted through 14 year old resistance as it looks poised for more gains and to end its 25 year bear market (see chart below). This has resulted in the Yen making a 7 year low in an attempt to make Japanese multinational corporations more competitive.
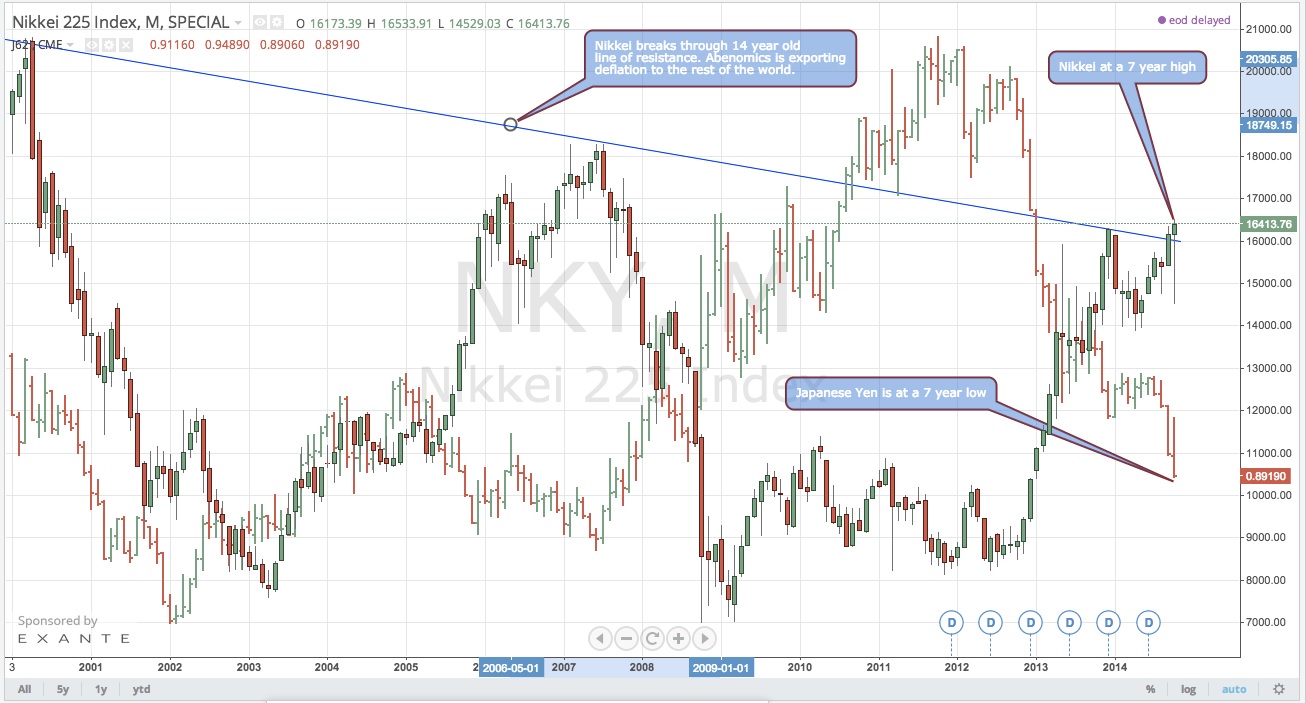
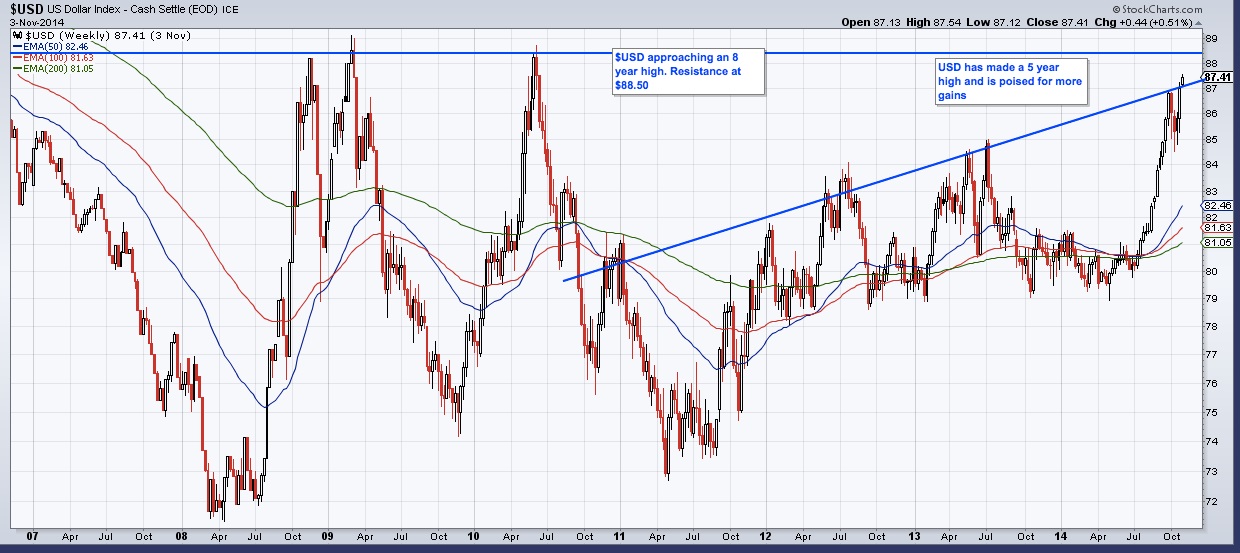
The net effect of this is the BOJ exporting deflation to the rest of the world and sending the US Dollar to 5 year highs and looking to break through major resistance (see chart below). This has led to a rout in all commodities (as commodities are priced in dollars) and foreign currencies as described in a previous article.
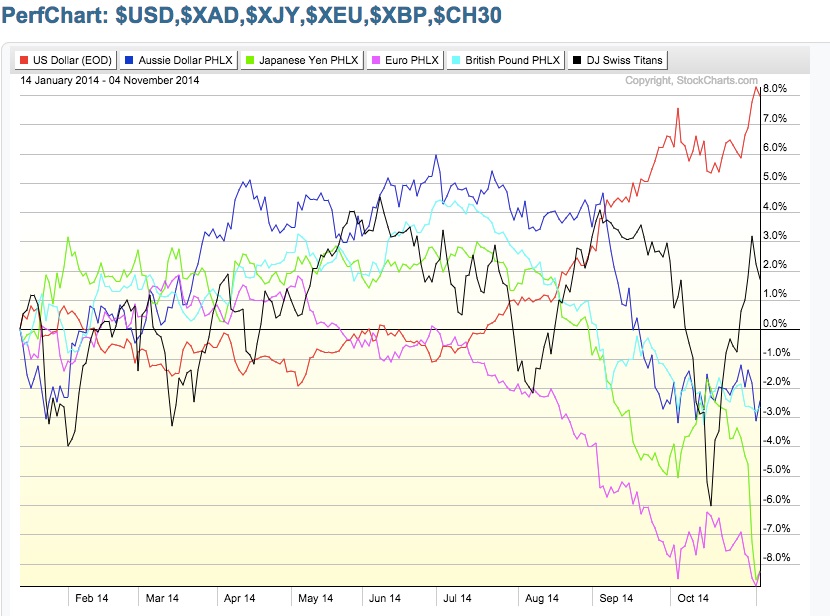
This chart shows all the major global currencies vs. USD:
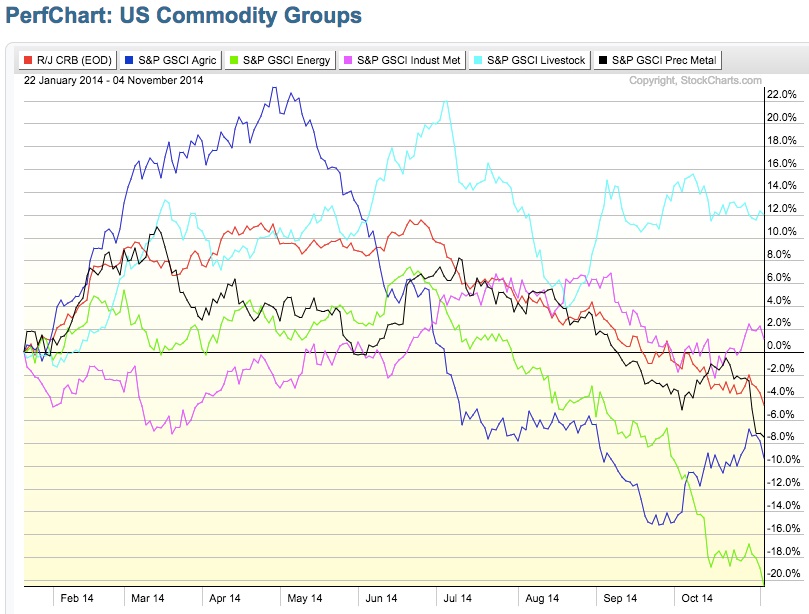
This chart shows the performance of the all the commodity groups in the wake of dollar strength and the specter of deflation. Energy, agriculture, and precious metals have been hit the hardest.
Bitcoin and Gold
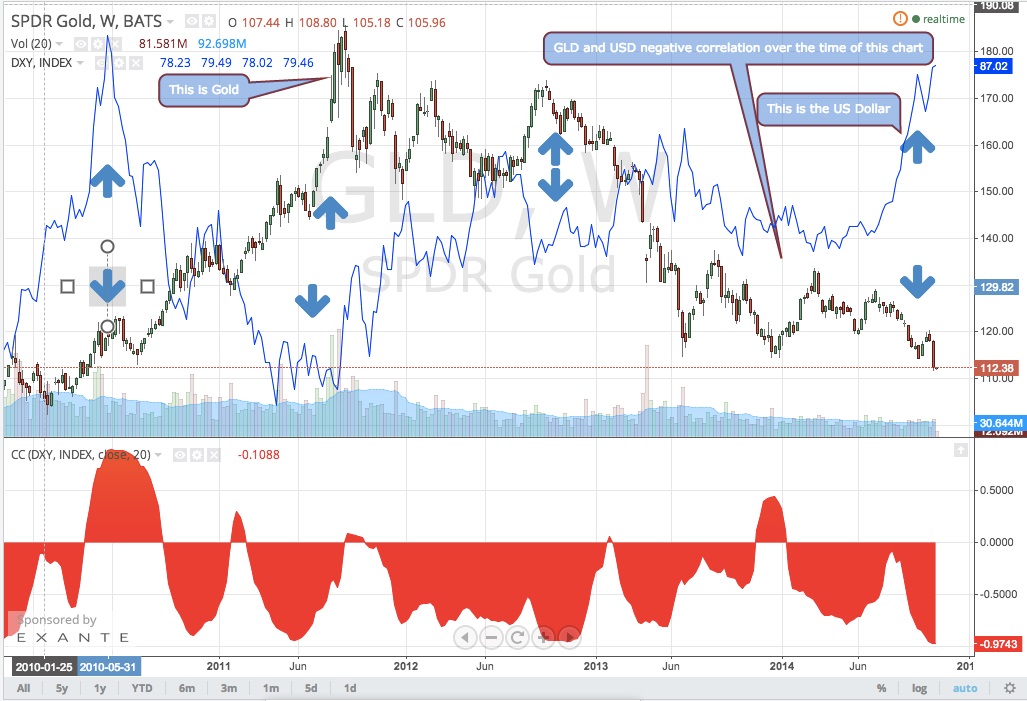
Below is a chart of Gold overlaid with the US Dollar since 2010. This chart could be any commodity, but since Bitcoin and Gold have a strong positive correlation (.87 currently) I thought it was worth showing what dollar strength does to Gold and essentially all other commodities. I have labeled the chart and it really speaks for itself.
The last and final chart I have overlays Bitcoin with the S&P. Until August, they moved in the same direction, and then in July/August they decoupled and starting moving in the opposite direction. This was around the time the US Dollar starting making its big move to multi year highs.
I show and describe the correlations between bitcoin, Gold, USD, and the S&P below. While these are small datasets, trying to find patterns in the data and where global capital flow is what we are looking for. Perhaps a major correction in the S&P or an easing of US Dollar strength and a subsequent rally in commodities can lead Bitcoin out of its current downtrend.
Also, seasonal patterns are coming into play for both Bitcoin and gold. November/December has seen strong uptrends in both during this time of year. Obviously with gold this pattern holds true for a much longer period of time, but if we are going to see the same patterns repeat themselves we should start to see some accumulation in these asset classes as they both massively underperformed.
Another point I have noticed with Bitcoin, is that it had the bear whale bottom at around 300, subsequently it rose to over 400, and is now back down in this area retesting. It has been a classic retest on low volume, which is what one would want to see before the next up move is confirmed. So far, Bitcoin has held its support area around 330 on this retest, without an acceleration in volume to the downside.

About the author
George Samman is the co-founder and COO of BTC.sx, the world’s first Bitcoin-only trading platform. He is a former Wall Street Senior Portfolio Manager and Market Strategist as well as a technical analyst. He holds the Chartered Market Technician (CMT) designation. A seasoned trader, George has over ten years of experience in the financial markets.
Did you enjoy this article? You may also be interested in reading these ones: