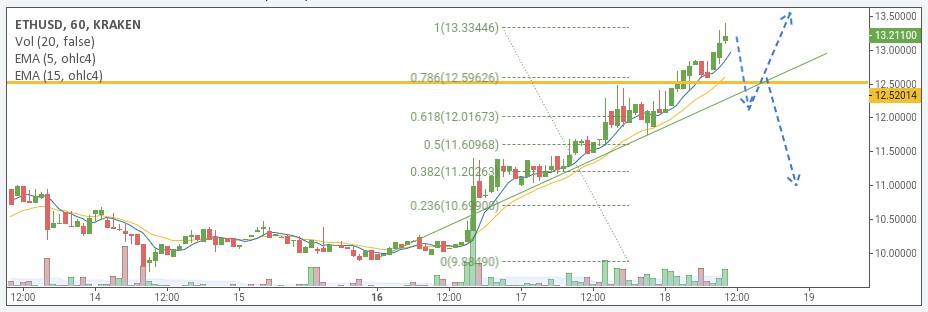
Ethereum’s price is moving along a medium-term upward trend. The cancellation of a likely flat has provoked this impulse.
Where can a new stop happen?
The cancellation of a flat wave scenario meant that there is a medium-term trend underway. Because of that, there was no turn to decline and a quite powerful upward trend has played out instead.

In order to predict the most likely stopping point for this upward trend, a number of important factors have to be taken into account, all of which are interconnected. First off, we have to determine the minimal medium-term target. The whole upward movement can turn out to be a wave of a medium-term flat. If that is the case, the peak of the supposed wave will be around $14. Then, to confirm that this is indeed a wave of a flat, the structure of Ethereum’s price has to be broken. At the current moment, the level of $12.5 is responsible for that, where several key instruments are intersecting: the Fibonacci level 78, the diagonal channel and the accumulated volume level. Hence, a turn is most likely to happen there.

The upward trend can stop for at least a downward correction, if a turn forms at the level of $12.5.
