Ethereum is at the birth stage of a medium-term trend. The likelihood of the price growing or falling by 50% is quite high. Which direction will Ether choose?
ETH/USD
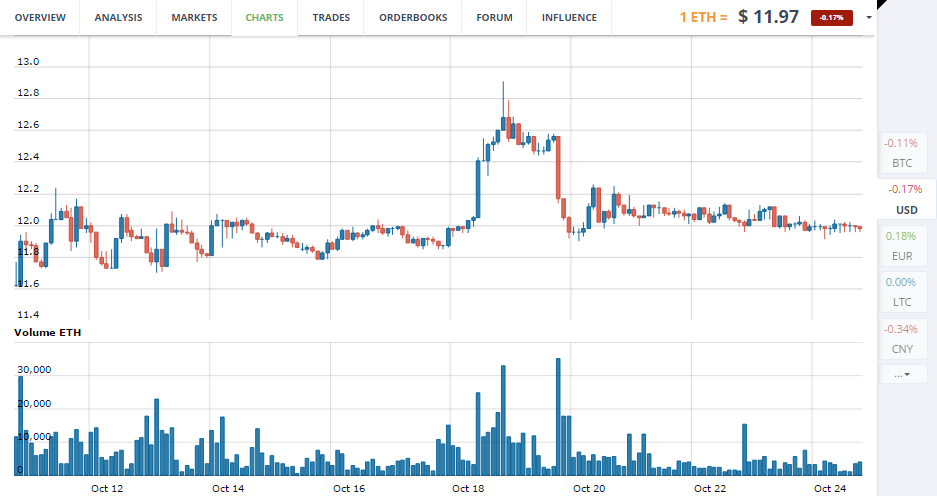
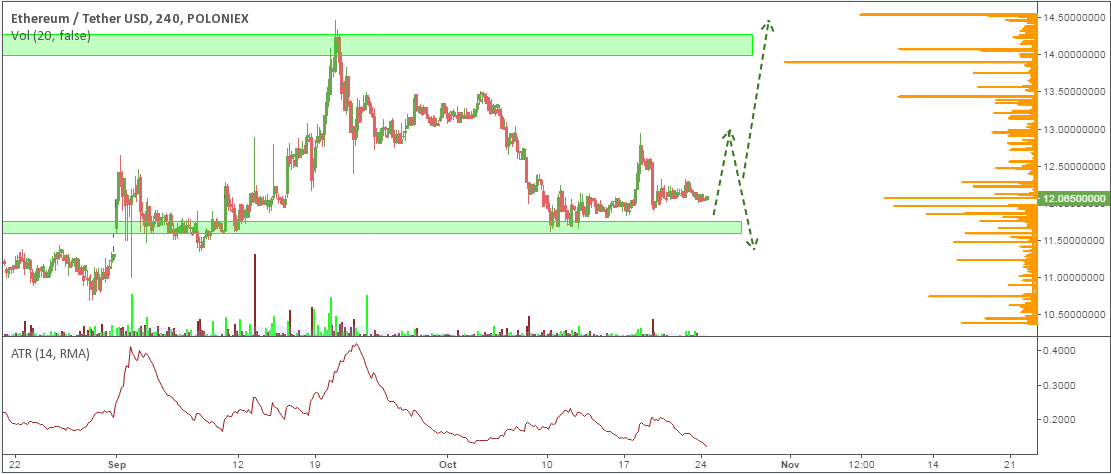
An upward rebound towards the downward trend from $14.5 to $11.6, which was predicted earlier, has been naturally formed. The rise of Ether’s price towards at least the diagonal channel near $13 was necessary. This gives Ether a decent support from the bulls. This rebound was as natural, as the micro-flat which is currently present on the charts. All that is due to the fact that the current price isn’t unprofitable for both bears and bulls, short-term-wise.
Volatility usually grows at peak values, which is explained by the fact that the majority of traders show themselves at such points.
In the current structure, such values are expected at the following marks:
- The peak of the downward movement near $11.5.
- The peak of the correction of that downward trend near $13.
It seems that the price has stopped about the center between these two marks, and hence, the majority of traders in this situation remains vague.
The target of the upward correction towards the diagonal channel near $13 has been reached. That means that the structure of the movement is prepared for both upward and downward movement in the medium term.

Two weeks earlier the situation was definitely looking in favour of the bulls. That was indicated by the volume of buy orders being twice as large as that of the sell orders. The technical analysis was also indicative of likely growth. These predictions were correct.
However, if we take a look at the volumes of stop orders now, the forces are almost equal.
A large volume of buy orders up to $11.5 will slow the price down within that range, and the sell orders near $13.5 will provide serious resistance for the upward trend. That’s why the prices of $11.5 and $13.5 will be the levels, where the medium-term trend is most likely to begin.
If Ether’s price returns to the $11.5 mark, there will be two possible scenarios: either the movement will become the peak of a rebound towards the upward trend from $7 to $14, or a turn will form, and the third downward wave will be formed of a similar scale to the first one, which took place from $14.5 to $11.6. That means that for both scenarios, we need to see upward movement from the $11.5 mark. In the first case, an upward trend will begin, and in the second, there will be a fortification and an upward rebound. Naturally, we should also be prepared for an emergency, which could lead to the price simply collapsing. Similar scenarios in the opposite direction are expected at the $13 resistance.
Ultimately, unless the advantage is taken by either bulls or bears, Ether’s price will simply form a sideways movement between the two key levels of $11.5 and $13.5.

ETC/USD
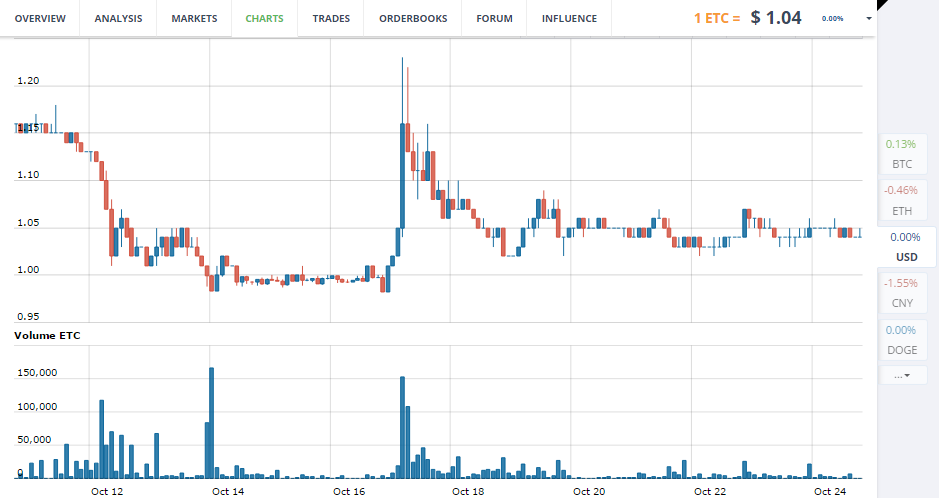
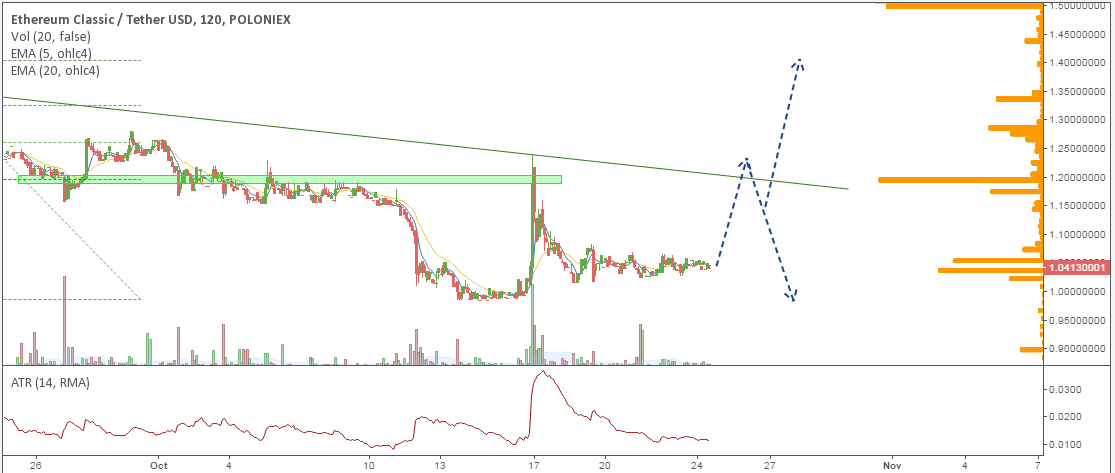
A similar situation is forming on Ethereum classic. The current price is unprofitable for the majority of traders. That is why until we have an initiator, the price will continue moving sideways, inside this narrow channel.

For a deeper fall to take place, the price of ETC has to fortify near $1 and form a turn. That scenario will indicate the absence of the bulls. Otherwise, there will be a new upward rebound.

Key technicals, where a change of trends is most likely:
- For a medium-term trend to begin on Ethereum in either direction, the price has to break through one of the two key levels of $11.5 and $13.5.
- For larger growth on Ethereum Classic to take place, it has to fortify and form a turn near $1.2.
