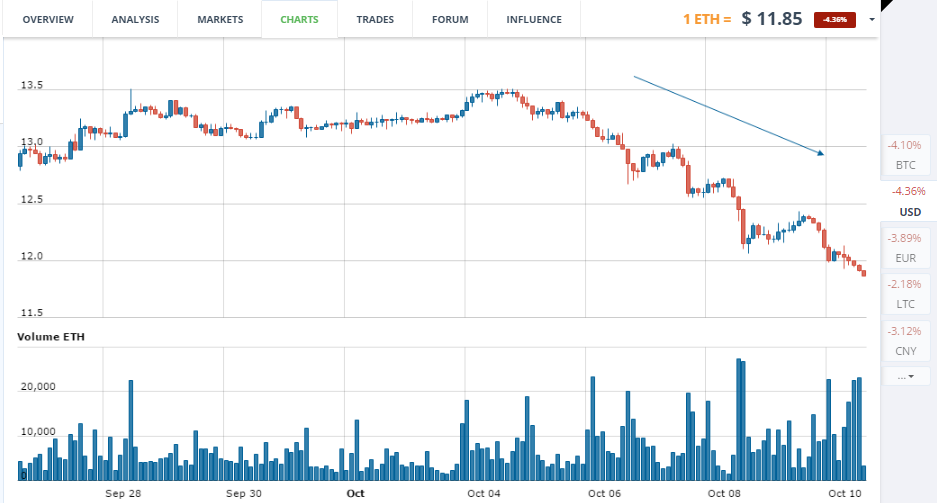
Ethereum’s price is heading down. The short-term downward trend, which has held for almost the entire week, has reached a key level. It is time for a natural upward movement.
ETH/USD
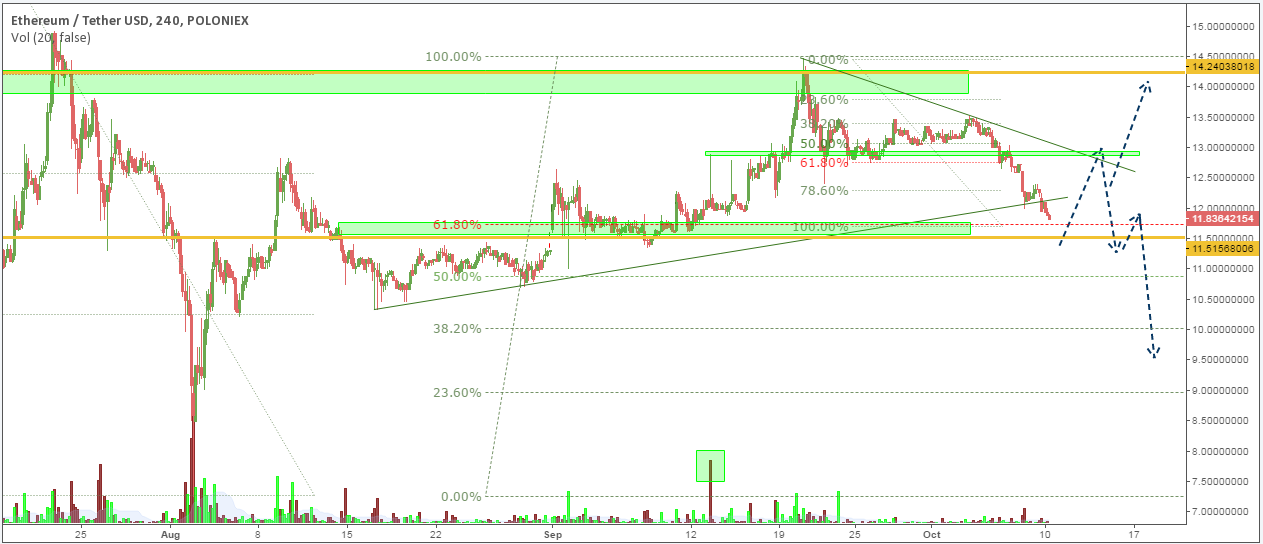
Last Tuesday, the advantage was held by the bears. Ether’s price has begun confidently forming a downward trend, never once breaking its structure. However, in order to continue its fall, the price has to break through a serious resistance line, which it has approached closely. Usually, an opposing force appears in such points, in the form of bulls, and the downward trend is followed by at least a rebound. Judging by the nature of that rebound, we can see if the price is going to fall even deeper.

The downward movement which has started at $13.5 is just a subwave of the medium-term flat. Consequently, for a medium-term trend to begin, the price has to exit that flat. Ether’s price will have to fortify at the bottom limit of that sideways movement, near $11.5, and stay below $13. The trend needs to correct towards at least the diagonal channel, in order to weed out the probability of a correction of a smaller scale. Only after that will this environment signify sufficient strength of the bears. In that case, the entire situation will give the first confirmation for a deeper fall. The bulls can show themselves near $11.5, but their volumes will be significantly lower than those of the bears. In that scenario, we will need a downward turning wave to finally confirm the power of the bears. Then, the minimal target for Ether will be below $9. Alternatively, if the advantage goes to the bulls, the price will break through the $13 mark, after rebounding from $11.5. In that case, the sideways movement will continue towards the next turning wave, and a turn to decline will have to be formed before the fall resumes.

ETC/USD
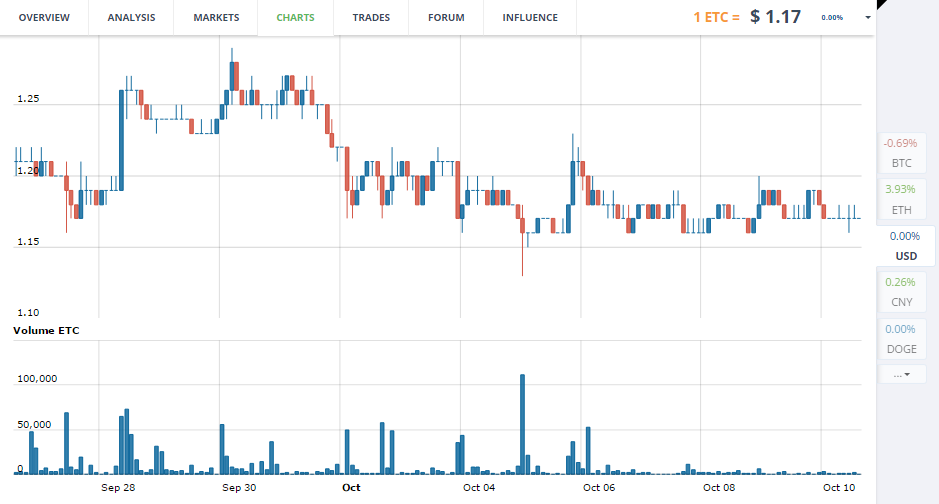
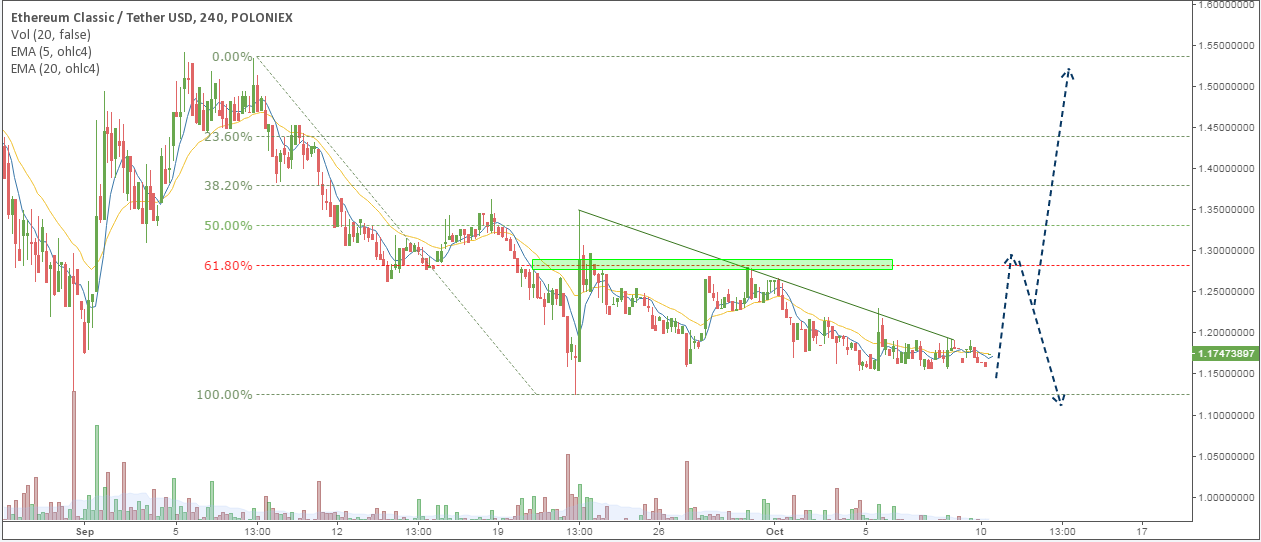
Ethereum classic has frozen at the peak of a downward trend. After a small period of growth on Thursday, ETC’s price has pushed back from the diagonal channel, without fortifying. Due to the fact that there was no turn at a key level, the fall continues. However, one can still see the presence of the bulls. ETC’s price is not allowed to drop below $1.15, at least for now.

For as long as the downward trend’s structure isn’t broken, it will continue. Betting on growth is highly risky, because in the current circumstances the odds are on the side of a downward trend. Even betting on decline is only reasonable at the most important levels, where a turn is most likely to happen. In order to grow, Ethereum Classic will have to break through the level of $1.3. That mark is the top limit of the flat, which has started in late September. That means that this mark will be the most likely peak of a rebound toward the downward trend, which has started at $1.5. That’s why we need to cut off the probability of both the continuation of the flat, and the upward rebound. The price has to fortify near $1.3 and form a turn. In that scenario, ETC’s price will have more chances to grow to the next key level near $1.5.

Key technicals where a change of trends is most likely:
- For a deeper fall, Ethereum’s price has to fortify near $11.5 and form a downward turn at that level.
- For a turn to growth on Ethereum Classic, the price has to fortify and form a turning wave at a key level near $1.3.
