For timely updates on price updates, follow me @sammantic.
BTC price at press time: US$249.45
Last week’s price alert began with:
“Thus far things seem different. The one thing that continues to make me weary is the lack of volume. If we are going to have a truly sustainable advance, volume needs to pick up and price needs to burst through big resistance at the 200-day Moving Average at ~US$258. As long as price remains above the 50-day, a neutral to bullish stance should be taken.”
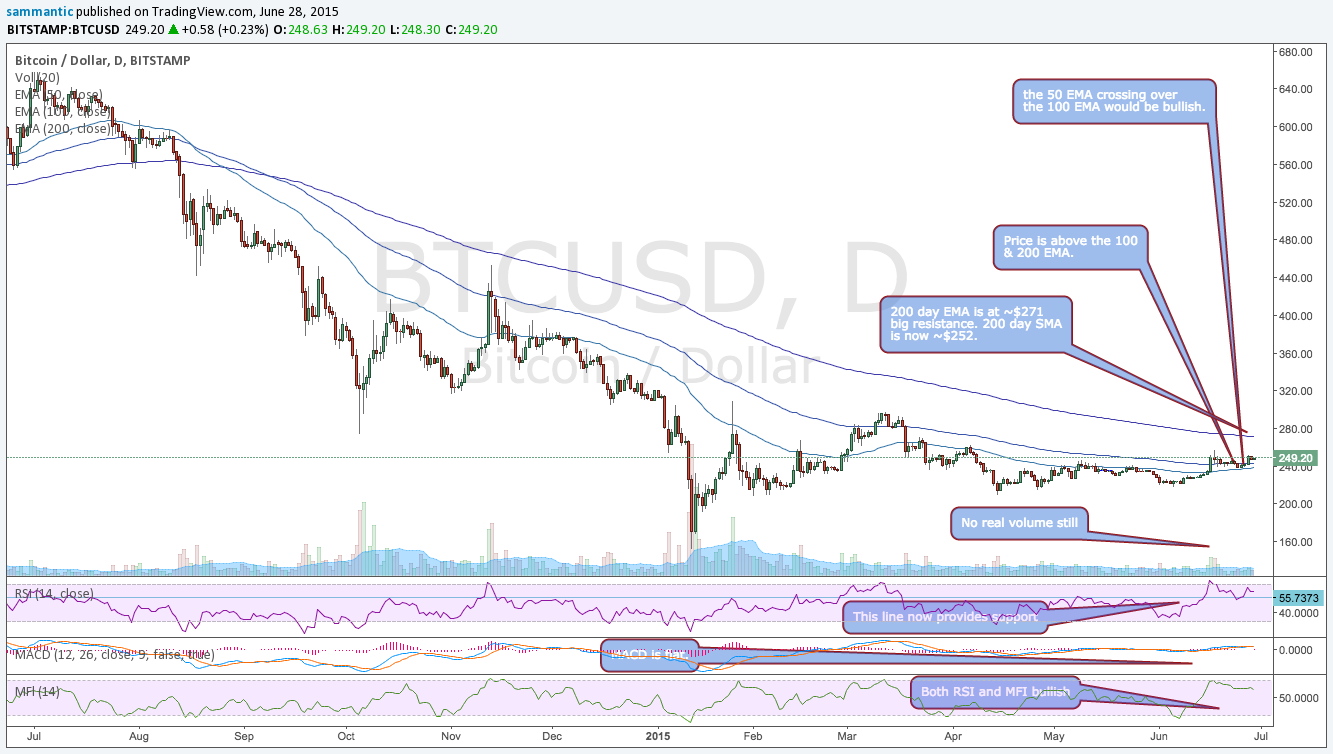
The price reached a high of ~US$252 and has now come down to ~US$249 and thus far the price has been consolidating above these two moving averages, which it has been doing since it broke out. This remains a bullish sign. Price is also above the ~US$243 where it started last week. This consolidation along with many key indicators should be seen as bullish. However price remains below the 200 day SMA at ~US$253 and the 200 day EMA at ~US$271. These both continue to act as resistance.
One other note: bear markets and bull markets both end in two ways through 1) time or 2) price. If price continues rangebound look for end of July/beginning of August for this bear market to end. I continue to expect price to resolve this market. Meaning we either break below support or break above resistance, both with volume.
Long Term

The bitcoin price continues consolidating above the 50 & 100 day Moving Averages since breaking through them. The 100 day has been tested and bounced, while the 50 day has not yet. This has been quite impressive. As has been the case for a long while, the 200-day lies on top of the 100-day, which lies on top of the 50-day. This is typical of a long bear market in price. One would want to see crossovers in these lines begin to occur if the price is truly going to come out of the bear. As the chart below shows, the 50 day is poised to cross over the 100 day. This would be a bullish sign.
The Money Flow Index (MFI) and the Relative Strength Index (RSI) continue to remain in bullish territory and continue to consolidate. This confirms the rise in price and is signaling a move higher may be in the cards. Interestingly enough, 50 looks like support in the RSI. The MACD continues to meander around the zero line and is on a small bullish signal as well.
ICHIMOKU
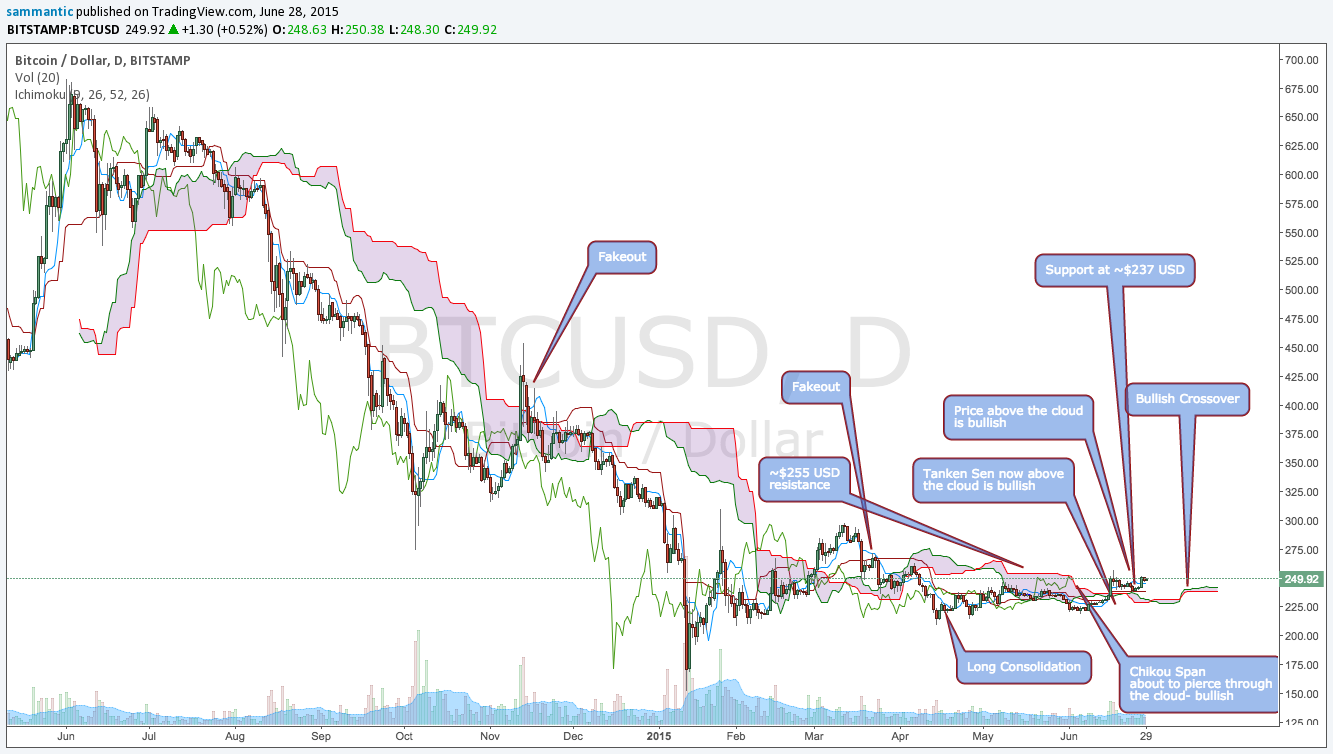
The 1-year Ichimoku (cloud chart) broke above the cloud and is now consolidating above it. Ichimoku is a trending indicator, so the longer we stay above the cloud the more likely the trend is changing.
The Tanken Sen made a positive crossover of the Kijun Sen last week and has now pierced through the cloud. Couple this with the Chikou Sen (Lagging Line) poised to pierce through the cloud and we have a bullish picture forming
Support is now at ~US$237, as that is the top of the cloud below. Resistance continues to be in the ~US$255–~US$260 area. This area coincides with the 200 day SMA. The cloud ahead has made a bullish crossover, but remains quite compressed. A widening of the cloud would be bullish for the price. The price has been a long consolidation range and is attempting to break out of it.
For further definitions of what is being discussed, please refer to this previous post on Ichimoku cloud charts.

Intermediate-Term Trend
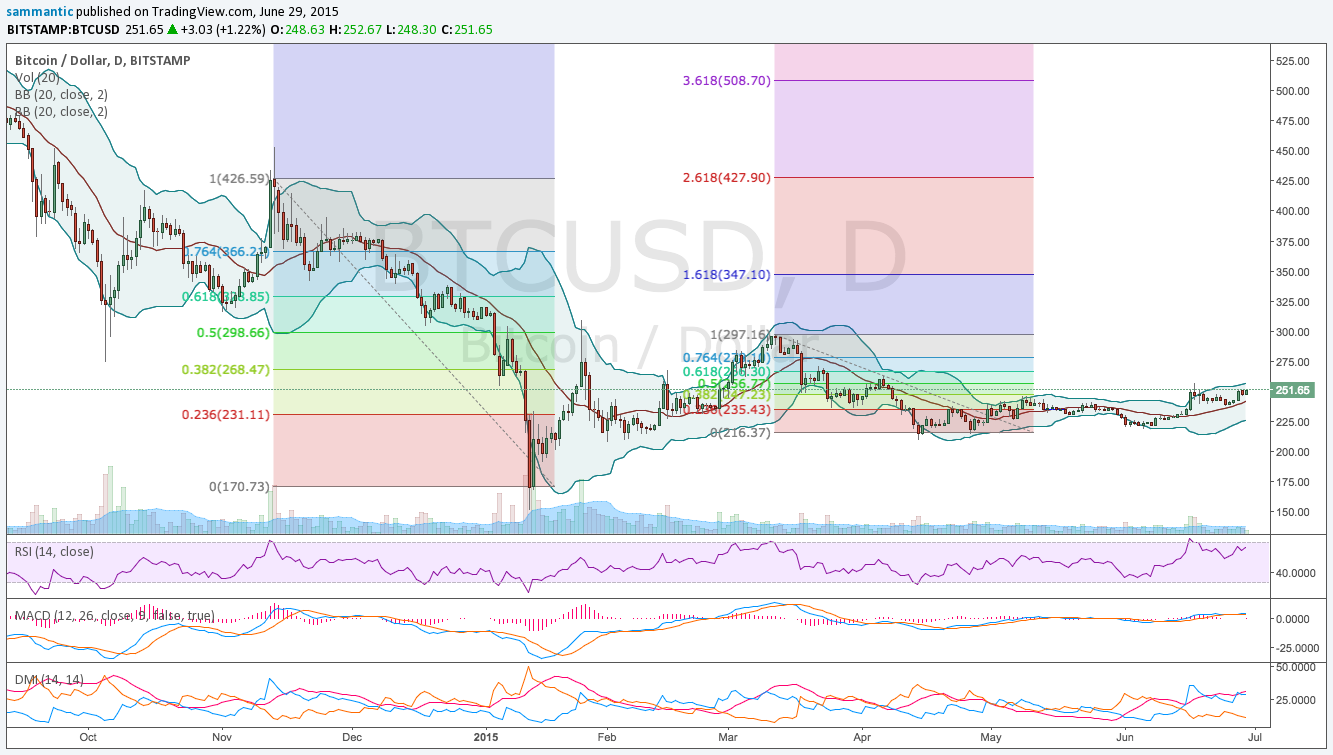
Fibonacci retracements have been drawn from two price tops: the mid-November high of ~US$424 and the mid-March high of ~US$298.
To the upside, a break above ~US$255 and ~US$264 (which almost coincides with the SMA and EMA 200-days as well as the top of Ichimoku cloud resistance) would make for a more bullish picture to emerge. This could pave the way for ~US$276 and ~US$295.
The Fibonacci Line drawn from the November high confirms that ~US$265 is key for a bull run.
On the downside, price needs to hold ~US$234 and ~US$230 to remain in a neutral position within a consolidation. The 50 day SMA/EMA is in this area as well so it’s an important threshold. If these don’t hold, it will be time to reassess the trend that is forming. Next week should be critical for price and give a better picture to the direction.
MACD is at its highest level since March, albeit at low levels and is on a buy signal. RSI as mentioned above is bullish too.
Included is the Directional Movement Index (DMI), which looks at buying and selling pressures. The blue line indicates buying pressure, the red line indicates selling pressure, and the orange line is the ADX, which indicates the strength or weakness of a trend.
Buying Pressure has crossed over the ADX and has returned, while Selling Pressure has fallen since last week. The bulls are in control right now. The ADX line remains above both the Buying Pressure Line and the Selling Pressure Line, but at higher levels than last week. This puts it on a buy signal. It also means price is ready to make a move.
The Bollinger Bands continue to widen and the upper band now sits at ~US$256. Price could make a run for this level which lines up with all the other key areas mentioned. If the bands continue to widen, we could see price finally start an upmove.

Short Term
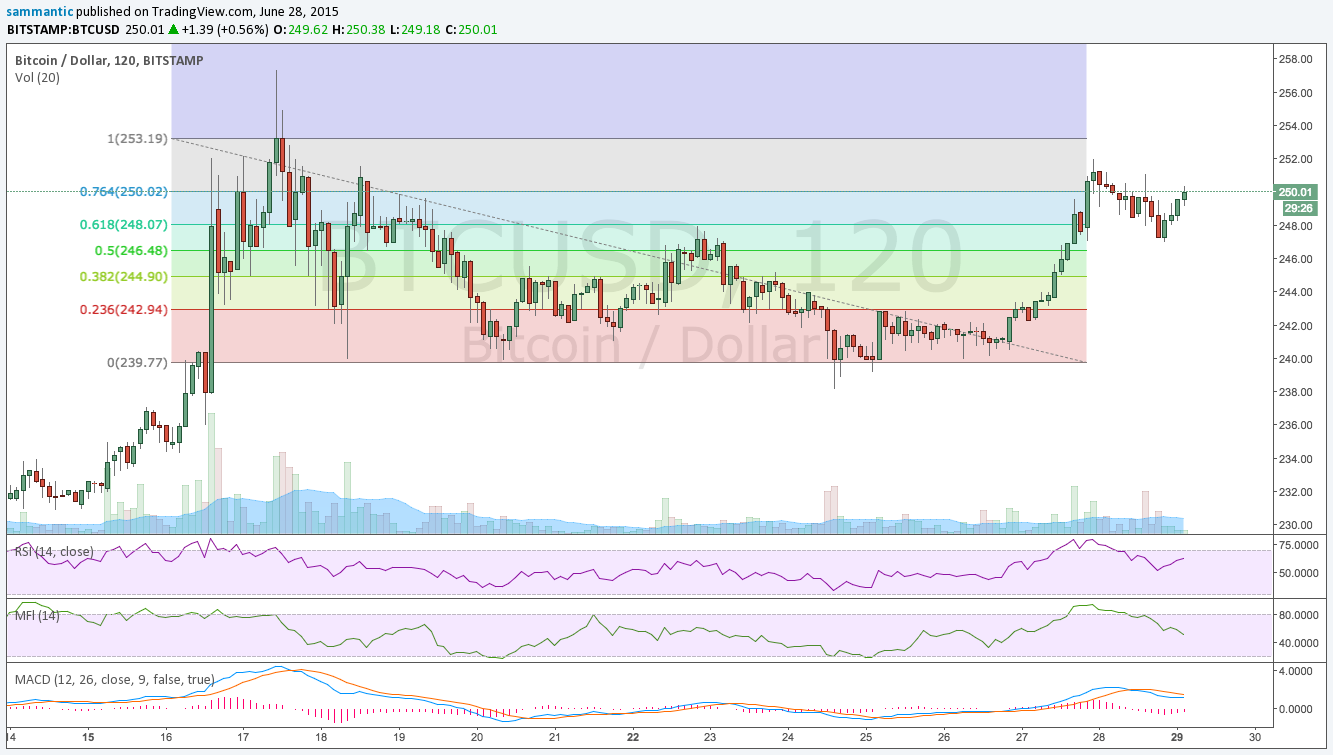
Since the high of ~US$256, price has been consolidating as the indicators went from overbought and have corrected to a more bullish stance short term. The RSI is bullish while the MFI has a negative divergence with price. The MACD remains in a short-term bearish position, but looks like its getting ready for a crossover. Downside support is ~US$248, ~US$246, and ~US$244. Price is looking like it wants to test that ~$255 level in the short term. Right now, the price is in a more neutral position.

The price action is very constructive and continues consolidating above the 50 & 100 day. Old resistance now becomes support and the indicators are in bullish positions medium and long term. The price tested the 100 day at ~US$241 and has held.
The picture continues to brighten although price is still stuck in this range.
Any pullbacks should be a buying opportunity as long as ~US$235 holds. However, we remain waiting for a break above the 200-day with volume to confirm that the bear market has ended.
Disclaimer: Articles regarding the potential movement in cryptocurrency prices are not to be treated as trading advice. Neither Cointelegraph, nor the author assumes responsibility for any trade losses, as the final decision on trade execution lies with the reader. Always remember that only those in possession of the private keys are in control of the money.
