The views and opinions expressed here are solely those of the author and do not necessarily reflect the views of Cointelegraph.com. Every investment and trading move involves risk, you should conduct your own research when making a decision.
The market data is provided by the HitBTC exchange.
Unlike 2017, the rallies in most major cryptocurrencies this year has been subdued. We believe that they are forming a bottom, which can take anywhere from a few weeks to a few months.
During this process, the price will remain volatile as the bulls, and the bears battle it out to establish their supremacy. The supportive news will see prices move up while adverse news can lead to a decline.
The latest set of news that influenced the decline for most cryptocurrencies is the investigation of South Korean exchange Upbit by the country’s Financial Supervisory Commission (FSC) and liquidation of Bitcoin by the executives in charge of refunding users affected by the collapse of the former Japanese exchange Mt.Gox.
The news on the fundamental side has also been positive with many financial institutions planning to enter cryptocurrencies, but it is still not reflecting in the price.
Investment research firm Fundstrat believes that this will soon change and Bitcoin can reach $36,000 by end-2019. They have projected a probable range of $20,000-$64,000. Even if Bitcoin only reaches the lower end of the range, it will return about 125 percent from the current levels.
Let’s see whether we should buy the current dip or wait it out.
BTC/USD
Bitcoin attempted to hold bounce off the 20-day EMA on May 09 but could not find buying support at higher levels. On May 10, it broke below both the 20-day EMA and the small trendline support. Our stop loss at $8,900 was hit today as the cryptocurrency plunged to a low of $8539.62.

On the downside, the 50-day SMA at $8423 is a strong support, below which the fall can stretch to $7,900. If this level also breaks, the BTC/USD pair can sink to $7,000 levels once again.
If the 50-day SMA holds, the digital currency will attempt to move up, but it might face resistance at the 20-day EMA.
The flattening of the moving averages points to the formation of a range. The supports and resistances of the probable range have still not established. Hence, we are not recommending any trade today.
ETH/USD
Ethereum failed to sustain above $745 on May 10. This resulted in a fall that has broken below the 20-day EMA triggering our stop loss at $680. With the fall, the ‘V’ shaped bottom formation has been invalidated.
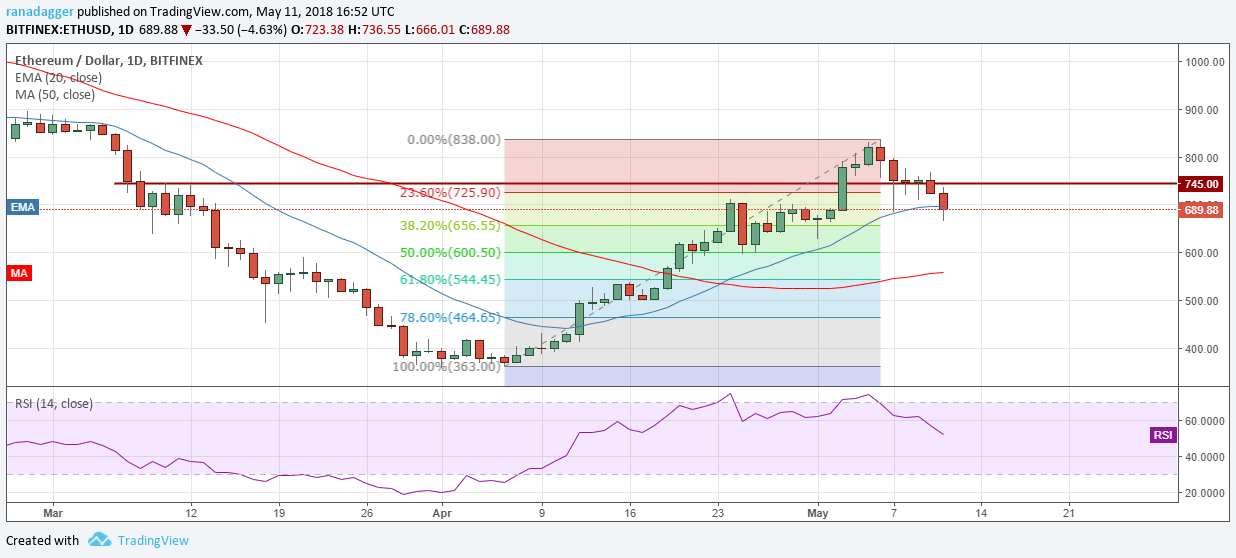
The ETH/USD pair has support at $656.55, which is the 38.2 percent Fibonacci retracement level of the rise from the lows of $363 to $838. If this level also breaks, $600.50 should act as a strong support, which is the 50 percent retracement level.
Traders should wait for buying to emerge at lower levels before entering any long positions.
BCH/USD
Bitcoin Cash failed to sustain above the $1,600 levels on May 10, resulting in a breakdown below the ascending channel.

Today, the BCH/USD pair plunged below the 20-day EMA and hit our stop loss at $1,400.
Currently, prices have recovered from the lows, and the bulls are trying to climb back above the 20-day EMA. If the levels hold, Bitcoin Cash will again attempt to scale above $1,600.
The critical support on the downside is $1,221. If this level breaks, the slide can extend to the 50-day SMA.
XRP/USD
Ripple has broken down of the range which gives it a lower target of $0.58223. Currently, the bulls are attempting to defend the 50-day SMA. Even if they succeed, the rebound will face a stiff resistance at $0.76 and the 20-day EMA.
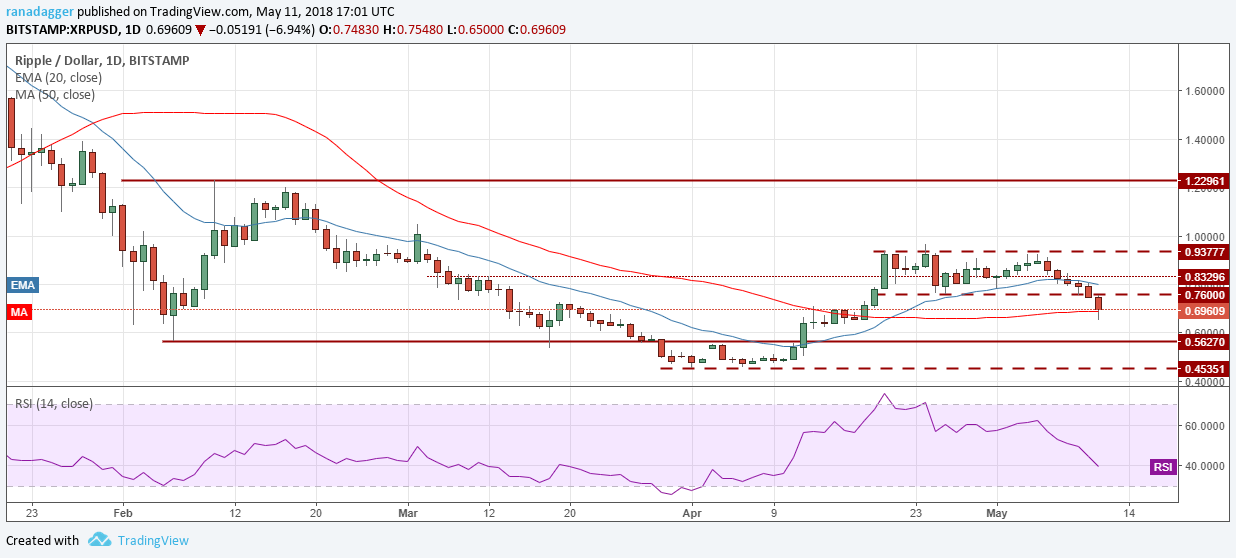
If the XRP/USD pair breaks below the 50-day SMA, the fall can extend to the next support zone of $0.56-$0.58.
Here too, the odds of formation of a large range have increased. We shall wait for the cryptocurrency to find some support before buying it.
XLM/USD
Stellar has broken below the horizontal support at $0.334 and is currently attempting to take support at the 50-day SMA. The failure of the bulls to hold a critical support indicates weakness.
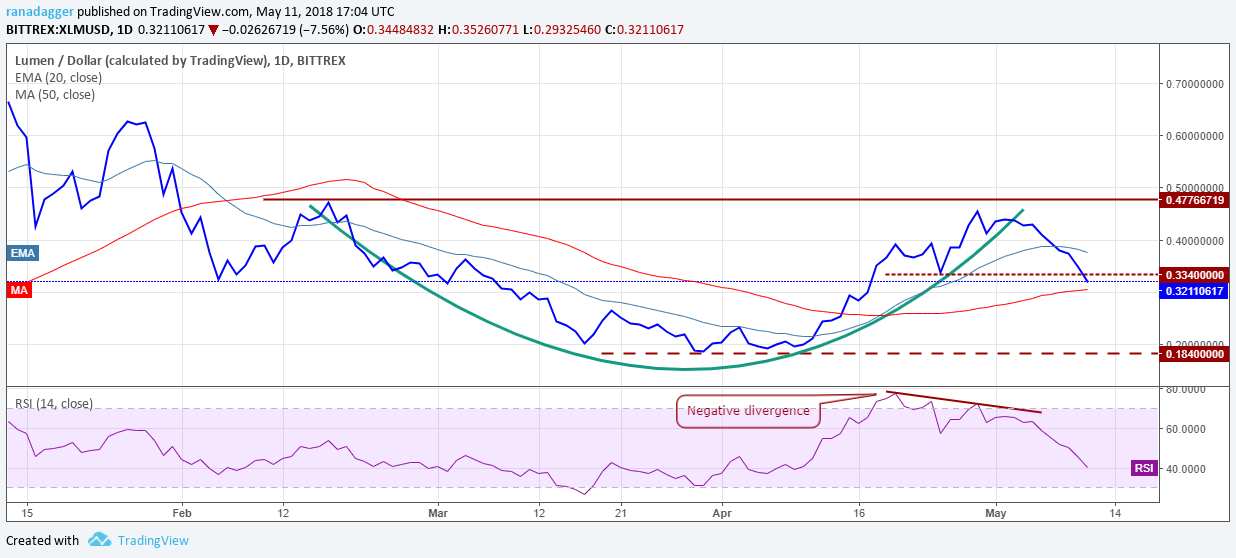
If the XLM/USD pair breaks below the 50-day SMA, it can decline to $0.184. The probability of the digital currency forming a cup and handle formation has decreased. It is likely to become range-bound between $0.184 to $0.477.
We shall wait for a new buy set up to form before suggesting any trade on it.
LTC/USD
Litecoin has broken below the ascending channel, the 20-day EMA, and the 50-day SMA. It is currently struggling to hold the horizontal support at $141.026.
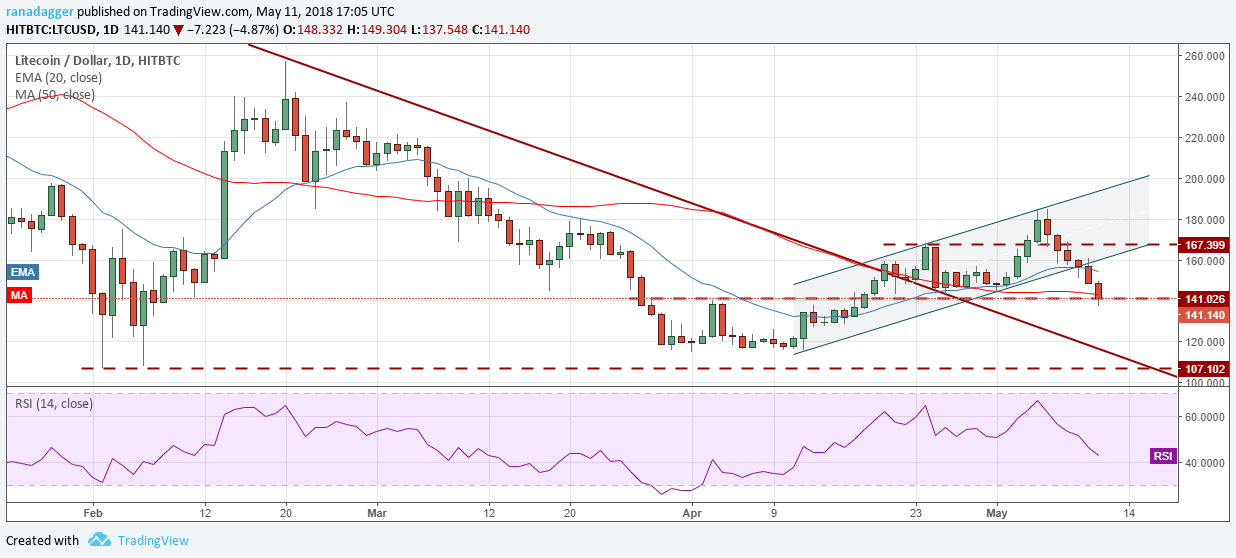
If the LTC/USD pair sinks and closes (UTC) below $141 levels, it will become negative and can decline to $127 and below that to $115 levels.
If the levels hold, the digital currency will continue to trade inside the small range of $141-$167. Due to the overall weakness, it is better to wait for the decline to end before buying.
ADA/BTC
The cup and handle formation on Cardano has failed. The bulls failed to sustain the price above the breakout levels of 0.00003445, which resulted in a slump that broke below our stop loss at 0.000032. The other stop loss at 0.000029 was saved by a small margin as the digital currency had slid to 0.00002902 levels today.
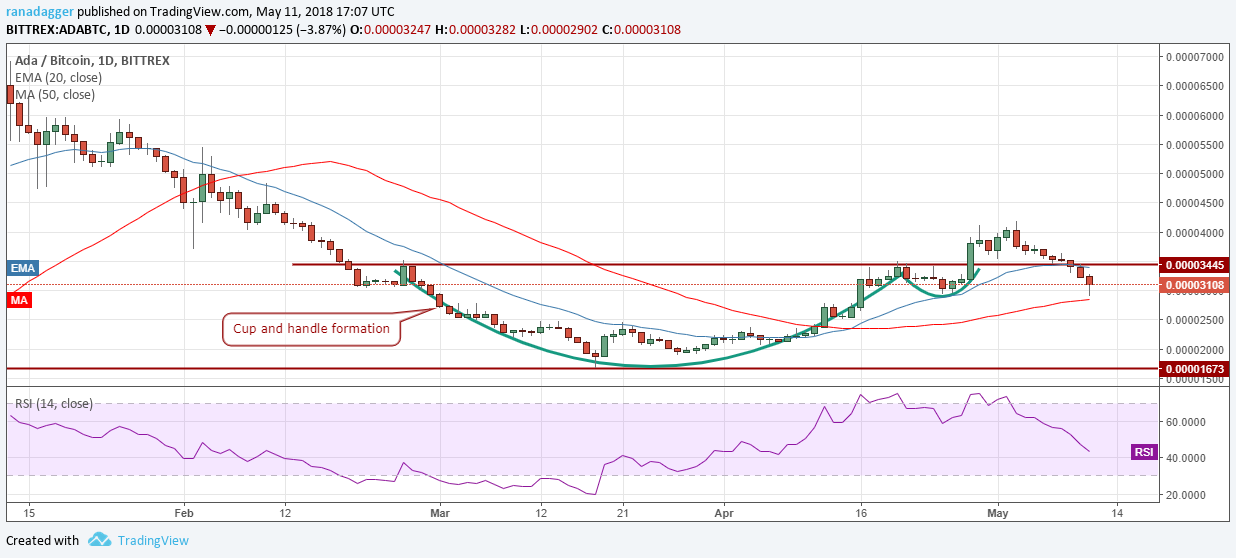
The ADA/BTC pair is currently at the 50-day SMA. If this level holds, the bulls will try to break out of the overhead resistance once again.
If this level breaks, it can again slide down to 0.000020 levels. Therefore, we suggest maintaining the stops at 0.000029 on the remaining position.
IOTA/USD
IOTA has broken below the horizontal support, the 20-day EMA and the support line of the ascending channel. This shows short-term weakness.
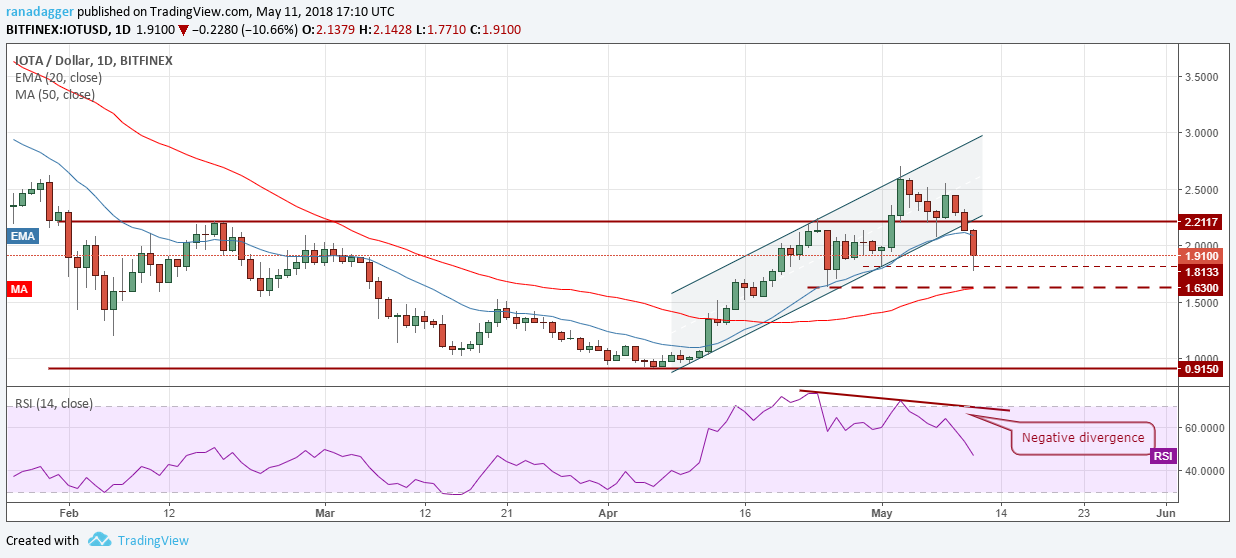
The IOTA/USD pair has a minor support at the $1.81 levels from where it is trying to rebound. If this level breaks, the fall can extend to $1.63, which is a critical support. We anticipate buying to emerge close to the 50-day SMA.
Let’s wait for the buyers to return before entering any long position.
EOS/USD
The consolidation in EOS has resolved on the downside as the price has broken down of the tight range. The bulls are trying to defend the 50 percent retracement levels of the rally from $5.9610 to $23.0290.
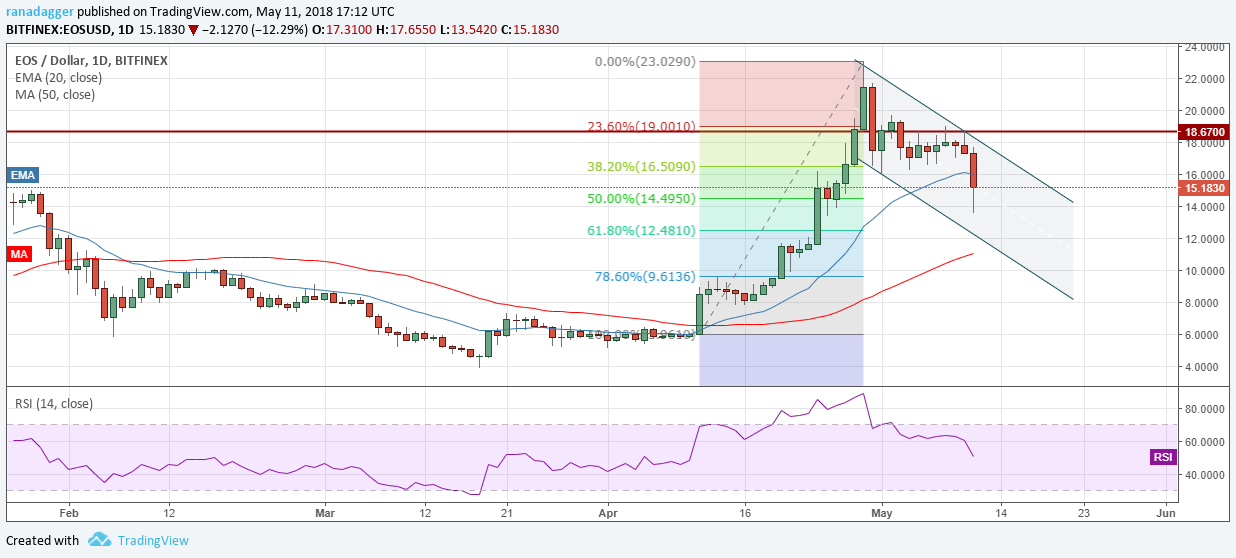
The EOS/USD pair can decline to the support line of the descending channel, which also coincides with the 61.8 percent Fibonacci retracement levels. The 50-day SMA is also just below this level.
While the trend still remains positive, it’s better to wait for the pullback to end before initiating any fresh long positions.
The market data is provided by the HitBTC exchange. The charts for the analysis are provided by TradingView.
