
Author’s note: Please follow me on Twitter (@Tone_LLT) for additional updates to the state of Bitcoin’s price volatility
Last Week’s Review
In last week’s post we concluded with the following statement:
We have now turned Bearish across all time frames. Until proven otherwise any bounce is expected to just be new lower high until we can get back above US$420. What we thought was a nice positive move on amazing volume a month ago that took us from US$275 to US$420 was not enough to get the masses on board. A reasonable bounce to $340 is very possible but we are now looking for prices to reach low US$300’s and if that support goes, there is not much holding it up until we match 2014 lows in the US$265-275 zone.
We will also remain diligent of the following situation
Bearish: As if our primary view was not negative enough we are now looking at possibilities of where a reversal is most likely if we fall below US$265. We will discuss this next week if the price does fall from current levels.
Bullish: This will be a tall order, all the resistance mentioned in the weeks prior to the BearWhale event are still there and now we are putting in more of them. First micro-sign of a reversal is a move over US$340 and staying above that value for a day or two, then the US$350-360 zone, US$385, US$400 and US$420. So until all of those are behind us, the overall trend remains down.
As you can see last Sunday we were very Bearish at a time when price had rebounded from around US$320 to US$330. In hindsight, the bounce had a little more legs in it than initially expected, but as the primary view explains, the overall picture will remain Bearish according to the charts as long as we stay below US$400 and most like US$420.
Yes this is a very unpopular view, but we remain very objective and re-evaluate the situation on a weekly basis. The short version, which will be expended upon here, is that the price making all the way to US$364 is an impressive bounce but more is needed to change the downward trend.
Of all the times this analyst hopes to be wrong - it is right here and hopefully we fly back up and past US$420 this week due to some of the news events that are happening at the moment. As usual don’t forget, the recommended amount of capital an average person should be putting at risk for their trading is 10-20%, so if you have accumulated 100 bitcoins, ideally you only want to use 15 or so for trading. The rest should be secure and you are the only one holding the private key with several encrypted USB backups in safe locations.
Let’s take a look at the long-term chart, which has now recovered all the way back to a recently drawn downward trend-line and this week will determine if we can break above it.
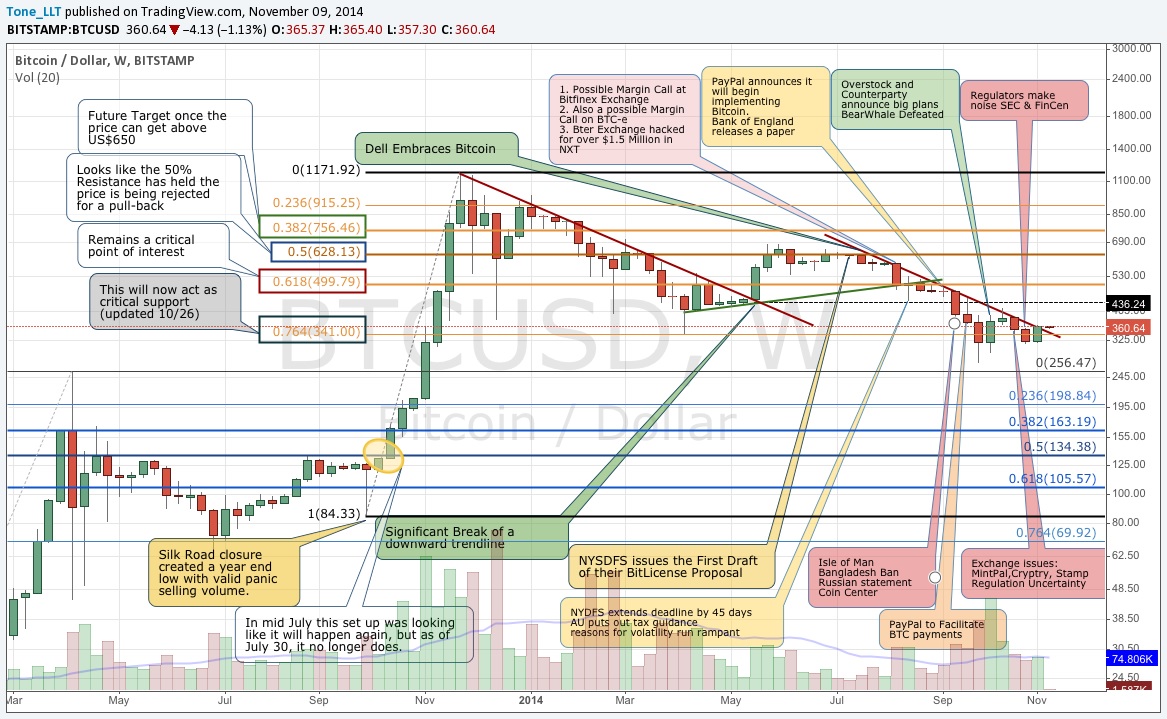
A break of this line to the upside would be a great first sign of a change in trend, but this would not happened until after the price is consistently above $365 to even consider the possibility. If you look back on the chart above to May, you will see a similar pattern of what happened the last time this kind of trend line broke to the upside, but there were 3 weeks of consolidation prior to that event.
Until it is clear that we are above this line, there is no reason to deviate from the overall trend, which as of this writing is still slightly to the downside.
Education (Fibonacci Retracements)
Fibonacci Retracements are a great tool to look for support and resistant values once a significant movement in price has started to reverse. Most charting software is able to plot these levels for you once you have identified the upper and lower ranges. The more significant levels are the 38.2%, 50%, and 61.8% values. Two additional retracements that traders watch but are statically a little less relevant are 23.6% and its opposite 76.4%, though the picture below is showing one of them to be supporting the price after the rebound.
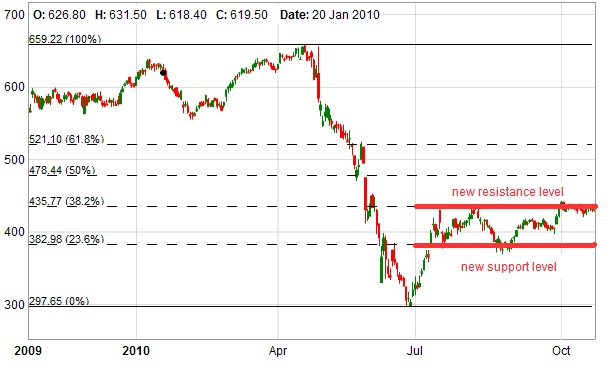
As usual, more detailed explanation and examples can be found at Chart School on StockCharts.com though many other sources explain this well. The general idea here is that prices will tend to rebound or pull back based on certain psychological levels.
For example, if a the price of Bitcoin has moved from a clear low at US$100 to a clear high at US$1,100 and then noticeably started to lose value, a trader would keep an eye on what happens after the price falls US$380 to around US$720 because that would be a retrace of 38.2% of the US$1,000 up move.
Fundamentals & News
It’s always amazing how many important things happen in the world of Bitcoin on a weekly basis, and as usual, here is a good way for readers to catch on the past week.
- Cointelegraph Weekly Roundup by Armand Tanzarian
- Bitcoin News Roundup by Bitsmith on TheCoinsman
- Weekly News Roundup by Brave New Coin
Once again, the highlight of the week was the clash between Bitcoin and authorities - this time represented by the take down of several websites collectives knows as Silk Road 2.0. What authorities will never understand is that it is impossible to stop social trends like this combination of using a private means of payment along with voluntary & mutually beneficial commerce that will only grow stronger.
There is no doubt that Silk Road 3.0 is already up and running and perhaps this time around, the admin will be smart enough to stay more anonymous and remain outside of US borders. Without a doubt this global one-year effort has cost the US Government more than the entire Market Cap of Bitcoins and it is starting to become clear that this battle is going to get very expensive for the authorities. In addition, as the Washington Post pointed out, Silk Road’s existence is making drug use safer and as more and more of these articles are hitting the main stream media, it is a nice boost for Bitcoin as it shows another example of Government bans being detrimental to the greater good of society.
An interesting article in Yahoo Finance discussed the possibility of Russians diversifying their runaway currency into Bitcoin and causing a potential spike in prices. Regular readers know that these are the kinds of scenarios that are very bullish for Bitcoin’s price. It may not be a coincidence that Russia was one of the first countries to begin officially criminalizing Bitcoin. The more important social aspect is the fact that these articles are coming from main stream channels, which was another reason that made Bitcoin so popular back in late 2013, when it got a lot more main stream media attention than it does today.
However, the Russian news may not be enough to fuel the fire under Bitcoin’s price. Russia’s domestic wealth is in the hands of a few elites and oligarchs and the Bitcoin market is still too small for them, and they have plenty of other means to move their money. When a nation bans, for example, the holding of US Dollars, it does not actually apply to the politically connected and in Russia that is pretty much everyone with real wealth. These laws only apply to the common people who collectively in Russia are no different then those in Argentina going through similar currency issues, but it is a trend that will spread to other nations.
The real catalyst will come from Europe where a currency crisis or a bank failure will affect a stronger middle class. Another way of looking at it is that the average person is Europe or North America is not affected by Russia’s currency issues, but if something was to happen in a Western nation like Italy or Spain, then a lot more people with some wealth will begin to take notice. For the time being, the Bitcoin market is deep enough to absorb the interest from Russians looking to diversify some assets.
Encouragement of the Week: It might be a small step but it’s the trend that matter as the Bitcoin industry is able to migrate talent from established companies as a high profile employee leaves PayPal for Bitstamp. But the partially disappointing part is that it was a compliance officer and not someone that could bring value or benefit to Coinbase’s clients.
Disappointment of the Week: As most people in the Bitcoin community have seen the pictures of the massive fire that destroyed a mining farm in Thailand. Competition and decentralization are always good so let’s all hope this is something that does not become a common occurrence.
Daily Overview
Here is our 1-year Daily chart still referencing Fibonacci Retracements and a few Trend Lines broken back in July:
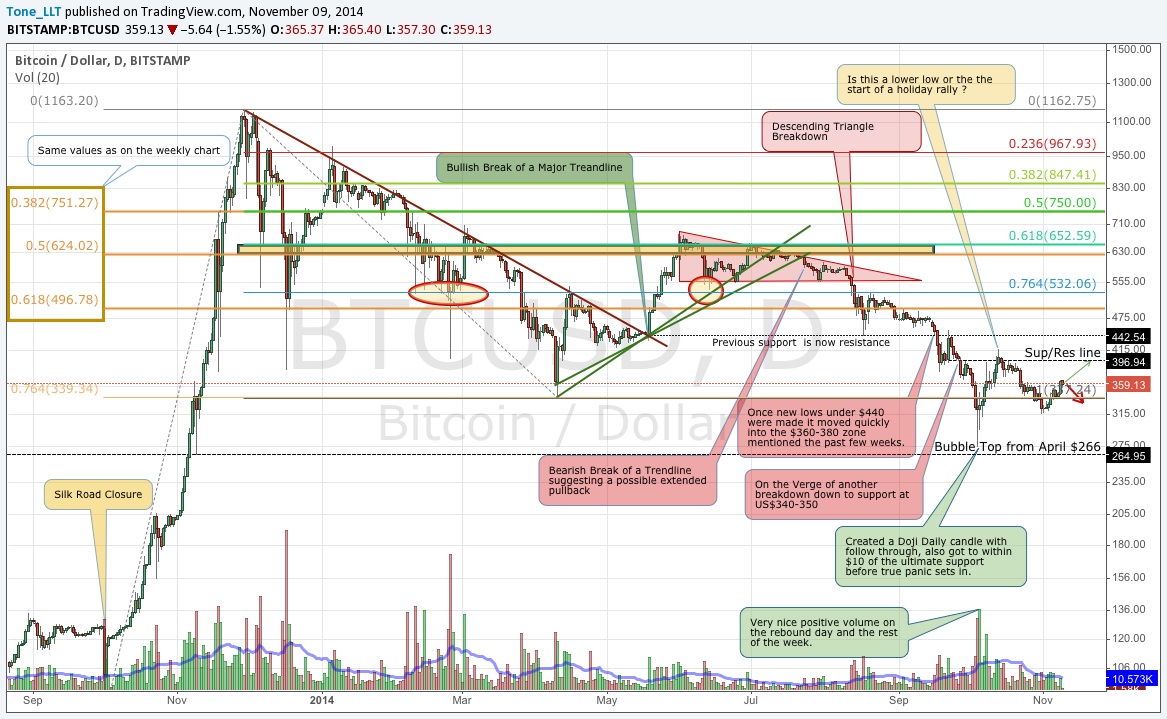
The full year look back still does not look healthy. It was turning into something good in early October when there was a lot of strong buying, but coming back to a low around US$315 was not encouraging. Everyone is now thrilled that prices are back to US$360 but we remain very cautious. Any reversal between now and US$420 would create a lower low and then the magic value will be that US$315 mark, which is on the verge of becoming critical support.
There is plenty of upside between here and US$420 so traders, especially those that like leverage, are urged to be extra cautious, but for the time being we are looking for prices to take a break before getting there.
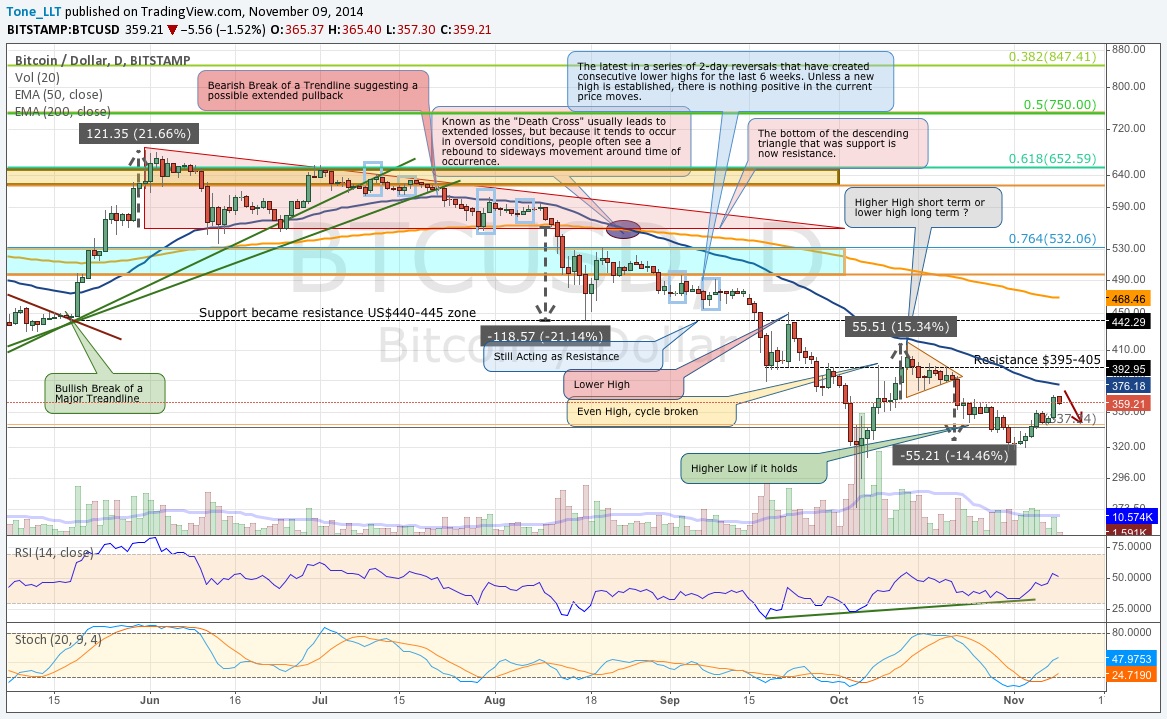
The Shorter-term chart is still showing some signs of life, but the upside remains limited. We are coming up on the 50 day SMA, which currently sits at US$375 and the previous 3 times the price came up to meet this moving average thing did not work out all that well and prices dropped significantly.
The two technical indicators on the chart (RSI & Stochastic) are showing some nice signs so that is one nice piece of encouragement. We are limiting our upside potential here to around US$375 and then are expecting some downside in prices to test the US$330 and perhaps even US$315. Another thing to keep an eye on is the symmetric triangle that might be forming if prices reverse any time between now and US$375.
Conclusion
We remain slightly Bearish long-term though acknowledge that the price may be breaking our descending trend line. We’re still pretty Bearish intermediate term unless we see prices move back into the US$400 range but we are a little optimistic short-term as this up move continues to break small resistance points one by one, but now we are going to start approaching more established resistance. We are expecting this move to take a decent pause between now and the 50 day SMA currently around US$375.
We will also remain diligent of the following situations:
Bullish: If the short-term trend has been reversed we would see resistance broken one hurdle at a time, which currently stand at US$375, US$400, US$420. Surpassing the US$420 mark would turn around most of the views on our charts, but until then we will not rush to judgment and follow what the larger trends indicate.
Bearish: We may have established a new visible low at US$315, if so then it’s a great sign. That is now our new line in the sand; any reversal at these levels needs to stay above that value. If US$315 cannot hold up the prices, we may see this year’s lows revisited.
Reference Point: Sunday Nov 9, 11:30 pm ET, Bitstamp Price US$360
About the author
Tone Vays is a 10 year veteran of Wall Street working for the likes of JP Morgan Chase and Bear Sterns within their Asset Management divisions. Trading experience includes Equities, Options, Futures and more recently Crypto-Currencies. He is a Bitcoin believer who frequently helps run the live exchange (Satoshi Square) at the NYC Bitcoin Center and more recently started speaking at Bitcoin Conferences world wide. He also runs his own personal blog called LibertyLifeTrail.
Disclaimer: Articles regarding the potential movement in crypto-currency prices are not to be treated as trading advice. Neither Cointelegraph nor the Author assumes responsibility for any trade losses as the final decision on trade execution lies with the reader. Always remember that only those in possession of the private keys are in control of the money.
Did you enjoy this article? You may also be interested in reading these ones: