The views and opinions expressed here are solely those of the author and do not necessarily reflect the views of Cointelegraph.com. Every investment and trading move involves risk, you should conduct your own research when making a decision.
The market data is provided by the HitBTC exchange.
VeChain is the fifteenth-best token in terms of market capitalization. The smart recovery from its recent lows has been on the back of the strong fundamental news. The market participants are excited about the VeChainThor Blockchain whose Mainnet Launch is expected in end-June.
So, can it move further or has it run its course? Let’s see its charts.
Weekly Chart

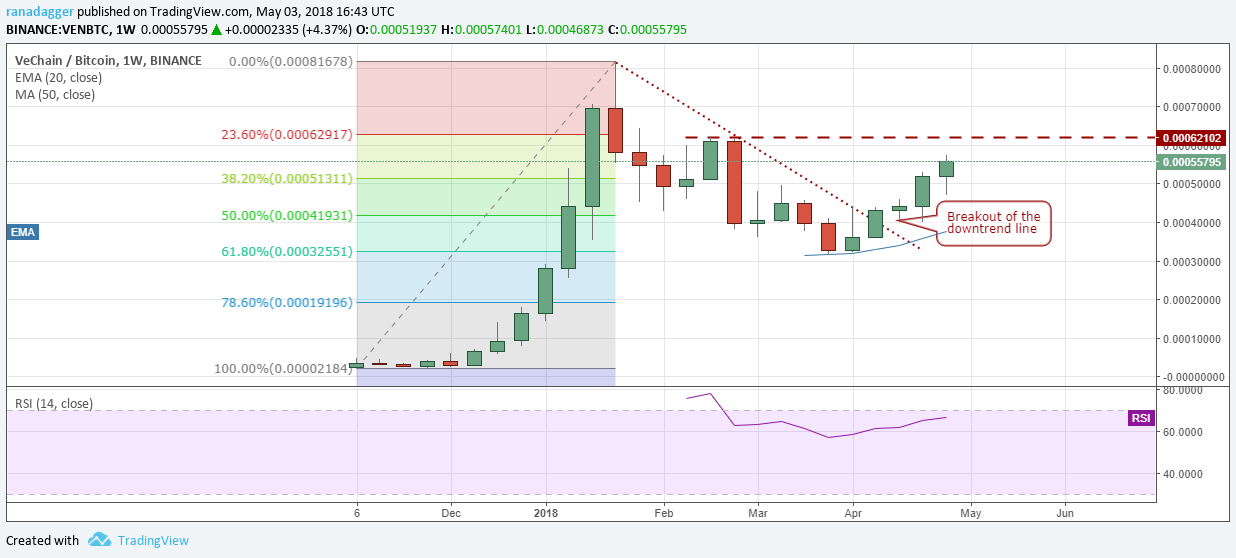
VEN remained in a tight range from mid-November to mid-December of last year. It started an uptrend in end-December, which took it from the lows of 0.00002184 on November 30 to an intraday high of 0.00081678 on January 22 of this year. That’s a 3639 percent return within two months.
The subsequent correction took support close to the 61.8 percent Fibonacci retracement levels of 0.00032752. The digital currency bottomed out on March 30, at 0.00031748.
After a strong break out from the downtrend line, VeChain can reach 0.00062102 levels where it might face some resistance. Once this level is crossed, a retest of the highs will be on the cards.
Daily Chart

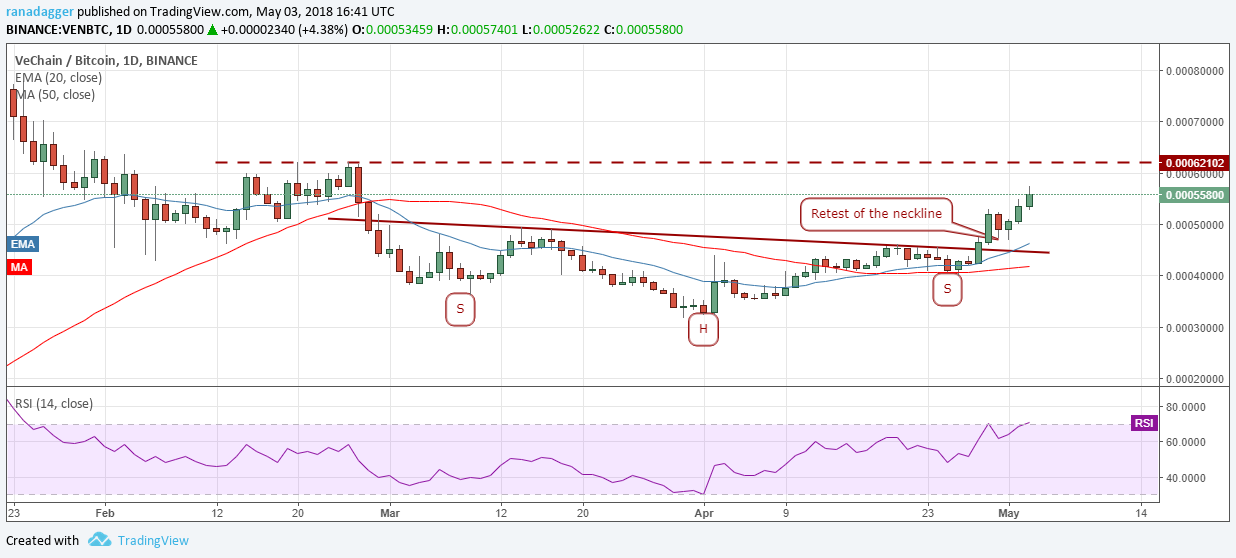
On the daily chart, the VEN/BTC pair has broken out of an inverted head and shoulders (H&S) pattern, which has a minimum target objective of 0.00063 levels. This is close to the overhead resistance at 0.00062102, therefore, we can expect a dip or a consolidation at this level.
On the downside, support exists at the 0.00047 levels, below which the neckline of the inverse H&S pattern will provide support.
How to trade the VENBTC pair now?
Traders who already own the cryptocurrency should hold their positions because a move to 0.00062 is possible. There is a high probability of a dip from the overhead resistance or a consolidation. Therefore, traders can book a small percentage of their position and attempt to buy it at lower levels. Long-term holders can trail their stops higher instead of getting in and out of the position because above 0.00062102, we can expect a straight dash towards the lifetime highs.
Others, who haven’t purchased the virtual currency should wait for a dip towards the 20-day EMA to buy and keep a stop loss at 0.0004, just below the 50-day SMA. Failure of a bullish pattern is a negative sign; below 0.0004, a retest of the 0.00032 levels is likely.
If we don’t get a dip to the 20-day EMA, traders can wait for the consolidation or correction at the overhead resistance and then buy the breakout. A break out confirms the resumption of the uptrend and a rally to the lifetime highs is likely. Once the bulls succeed in breaking out the lifetime highs, the digital currency can extend the uptrend to 0.00111242 levels. However, as most cryptocurrencies tend to give up their gains quickly, traders should trail their stops higher to lock in the paper profits.
The market data is provided by the HitBTC exchange. The charts for the analysis are provided by TradingView.
