The views and opinions expressed here are solely those of authors/contributors and do not necessarily reflect the views of Cointelegraph.com. Every investment and trading move involves risk, you should conduct your own research when making a decision.
The past few days have seen a series of flip-flops on news. First was the news of the Korean government banning cryptocurrency trading that led to a sharp fall in prices. Then came the rebuttal that there was going to be no ban in the near future.
The latest news from South Korea is that they have still not given up on the plan to shutdown cryptocurrency exchanges. The markets reacted with a selloff in all virtual currencies.
The second news was that Ripple had partnered with MoneyGram for money transfers.
This shows that the traders should not impulsively buy or sell on any news. It’s always better to wait for a trend to form and then buy into it. Is the current fall a buying opportunity or is there more to go? Let’s find out.
BTC/USD
For the past four days, the bulls have been attempting to hold the critical support of $12,600 to $12,900 in Bitcoin and push prices back into the symmetrical triangle.
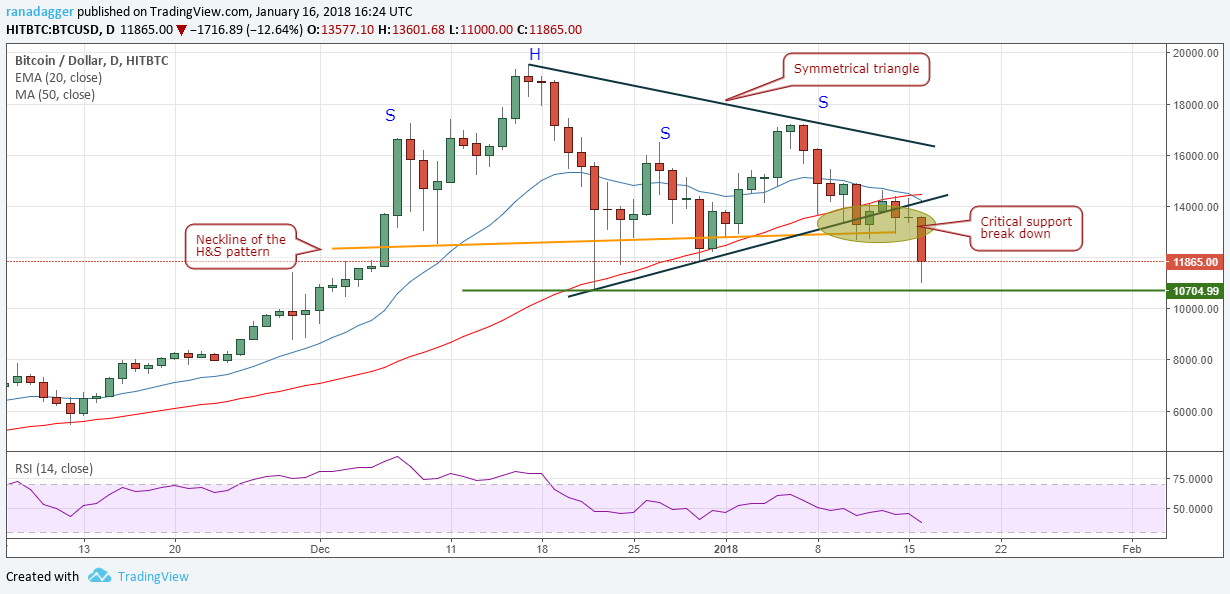
However, the bears did not allow the pullback to cross above the 20-day EMA.
Today, when the cryptocurrency broke below $12,500, it attracted huge selling, which resulted in a sharp decline to $11,000, close to the next support of $10,704.99.
We believe that the bulls will attempt to pullback from the current levels, but the bounce will not sustain and the BTC/USD pair will crack the $10,704.99 level and fall to $8,000.
The 20-day EMA and the 50-day SMA have completed a bearish crossover, which is a negative development.
Our bearish view will be invalidated if price climbs back above $15,000 levels.
ETH/USD
In our previous two analysis, we said that Ethereum will find it difficult to breakout of the overhead resistance zone of $1382 and $1434 and that is what happened. The cryptocurrency returned from a high of $1424.3 on Jan. 13.
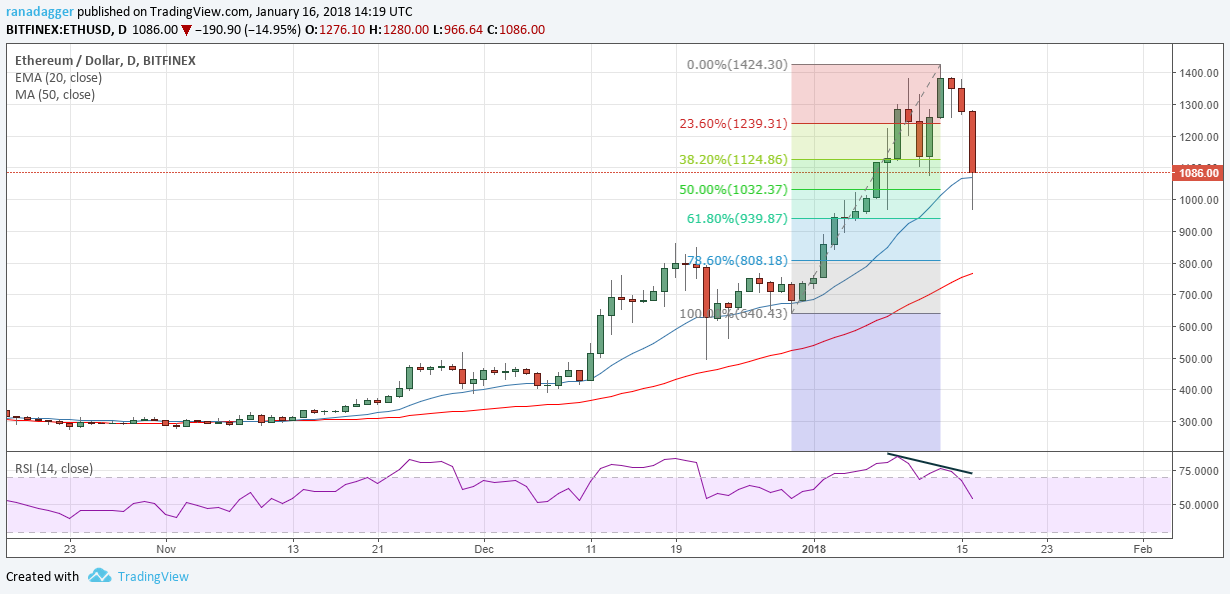
After maintaining above the $1250 levels for three days, the bears broke down below the support, which attracted profit booking. As a result, the cryptocurrency plunged to $966.64, which is just above the 61.8 percent Fibonacci retracement levels of the recent rally.
We also find a negative divergence on the RSI, which is a bearish development.
If the support zone between the trendline and $940 holds, we may see an attempt to pullback, which is likely to result in a range bound trading in the next few days.
Our view of a trading range in the ETH/USD pair will be invalidated if price breaks below the uptrend line.
BCH/USD
After trading inside a range of $2072 to $2950 for the past few days, Bitcoin Cash broke down below support.
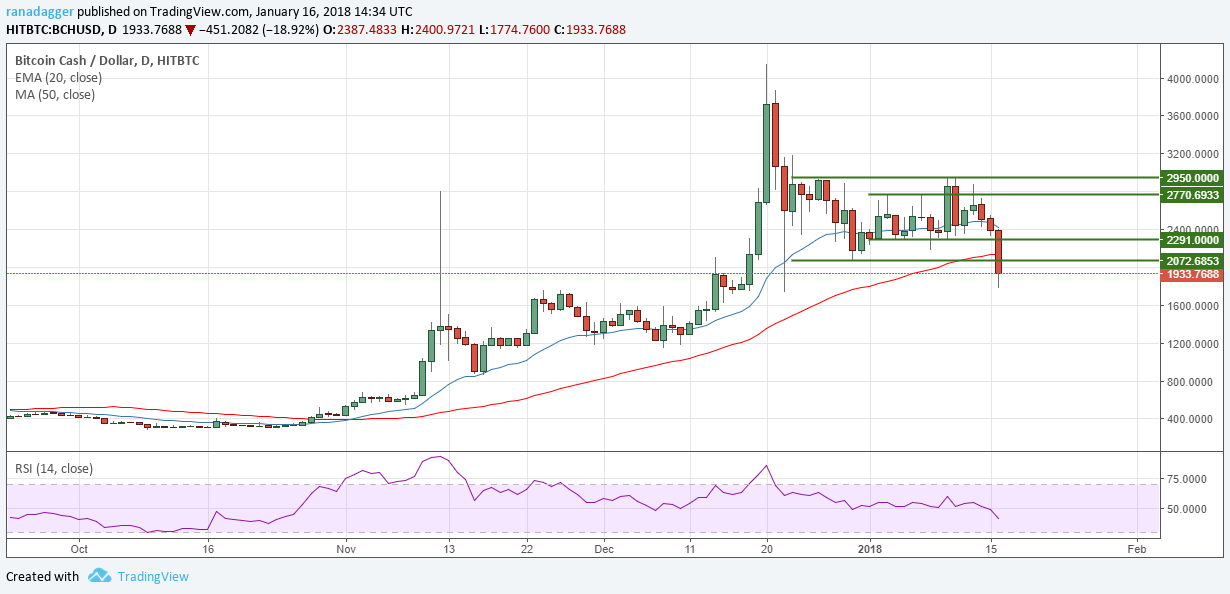
The pattern target on the BCH/USD pair following the breakdown is $1,194, however, we expect the bulls to attempt to hold $1733 levels, which was the intraday low on Dec. 22.
Our bearish view will be invalidated if the bulls succeed in pushing prices back into the range, above $2072.68.
XRP/USD
We had forecast a possibility of a fall to $1.40 in Ripple on Jan.6. Today, the cryptocurrency touched a low of $1.17.

The correction has broken below the 61.8 percent Fibonacci retracement levels, which suggests weakness.
The cryptocurrency is currently trading inside a descending channel. The downtrend will end when the bulls breakout and sustain above the channel.
Though the XRP/USD pair has plunged about 65 percent from its highs, we shall buy it only after it confirms a bottom formation.
IOTA/USD
There is a tussle between the bulls and the bears at the critical support of $3.03 in IOTA. While the bears have broken below the supports, the bulls are attempting a pullback.
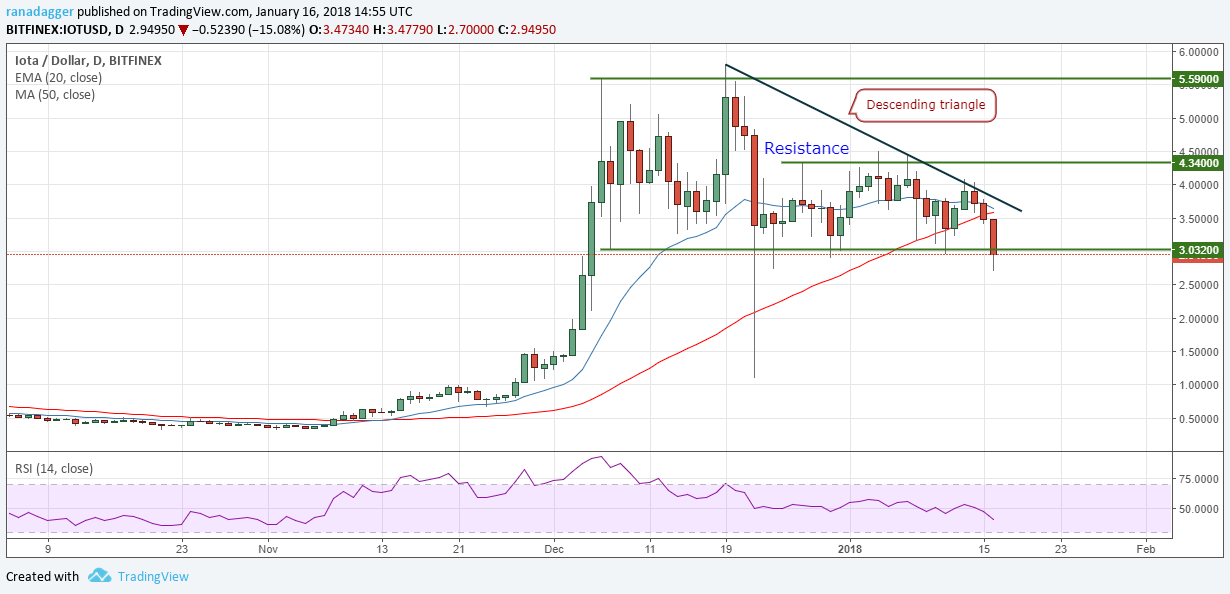
Along with the range, we also located a bearish descending triangle pattern on the IOTA/USD pair, which will complete if the bears manage to sustain below $3.03. Such a breakdown is likely to result in a decline towards the December 22 low of $1.10.
On the other hand, if the bulls hold the support, the virtual currency is likely to continue its range bound trading.
LTC/USD
Today, Litecoin broke down below the symmetrical triangle pattern and also the 50-day SMA, which is a negative development.
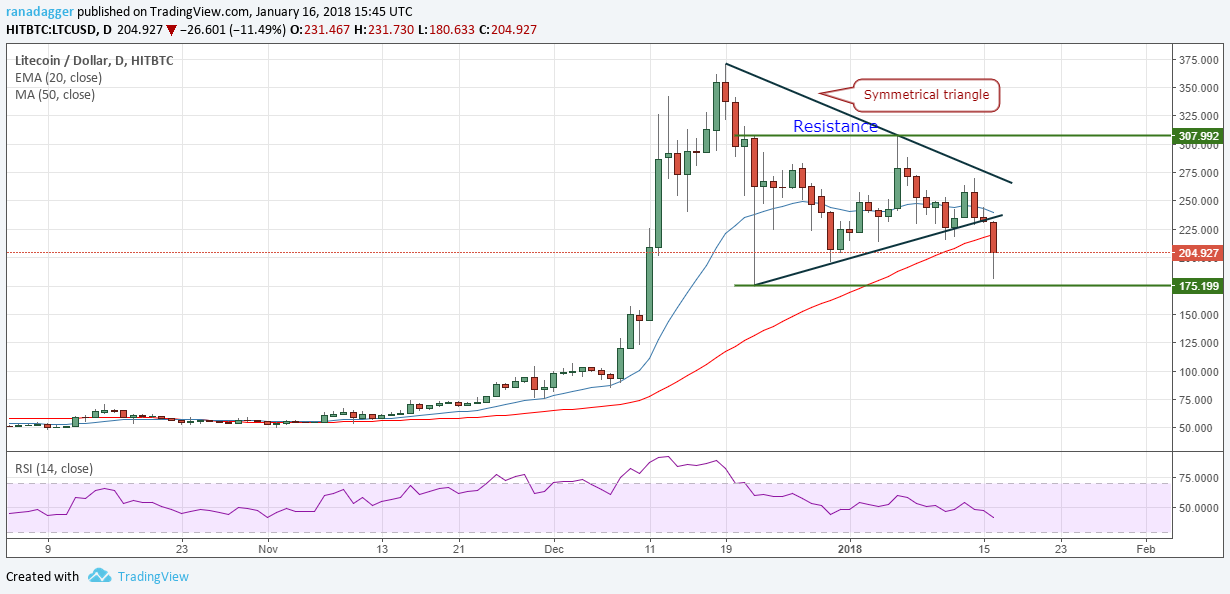
The bulls are attempting to hold the critical support of $175.19. If successful, a return to $230 is likely.
On the other hand, if the bears break below $175.19, a move towards $100 is likely.
Due to the uncertainty, we are not recommending any trade on the LTC/USD pair.
XEM/USD
We had suggested a long position in NEM in our previous analysis. The pullback on Jan. 13 did not reach our target levels and our stop loss was triggered today, when the bears broke below the uptrend line.
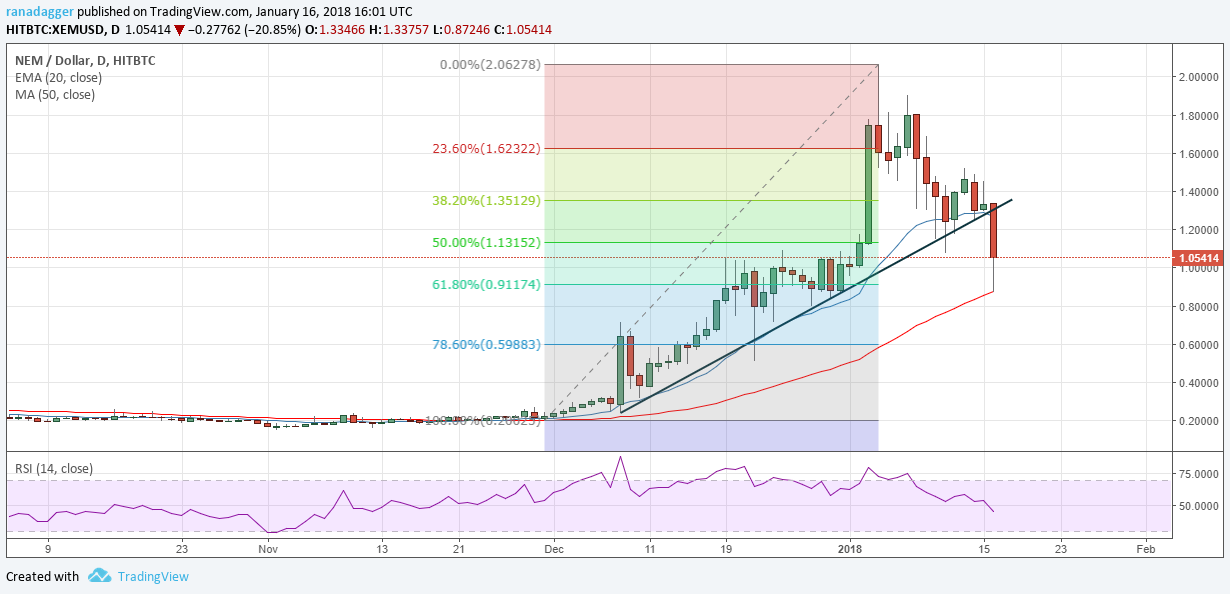
The bulls are attempting to hold the 50-day SMA, which is close to the 61.8 percent Fibonacci retracement of the rally.
If successful, we may see a pullback towards the trendline, else a fall to $0.59 is possible.
We don’t find any setup on the XEM/USD pair, hence, we are not recommending any trade on it.
ADA/BTC
We are carrying long positions in Cardano from 0.00005733 levels. Though price reached our first target of $0.00006616, it could not reach the second target objective of $0.00007221, because it topped out at 0.00006915. So, what should we do now?
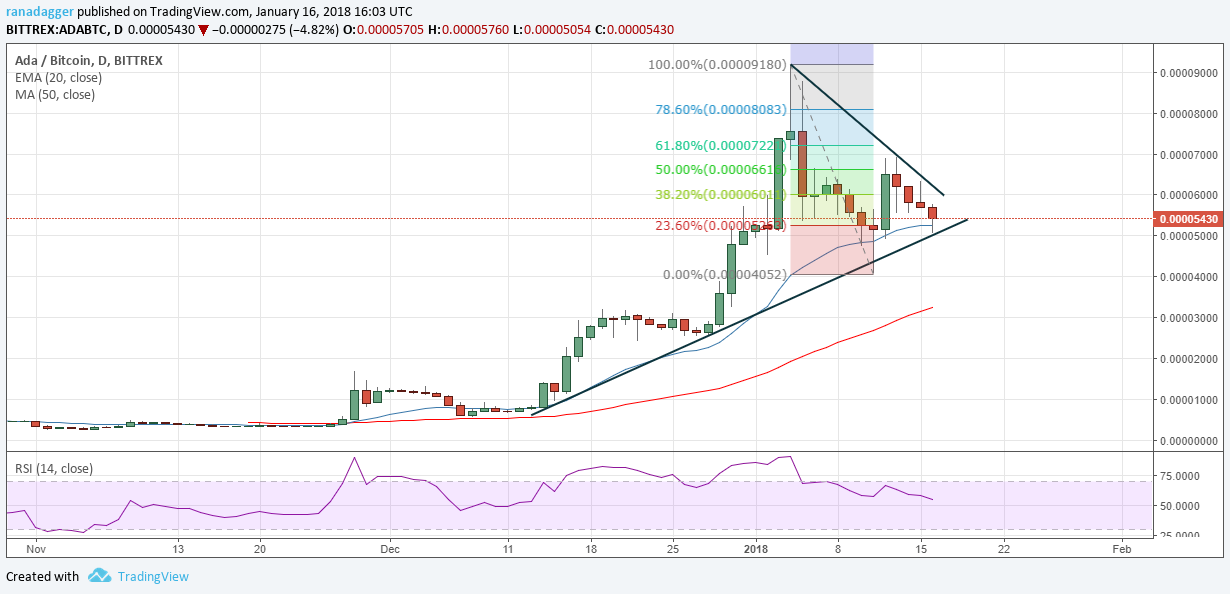
Currently, the ADA/BTC pair is holding the critical trendline support. Hence, for the traders who did not sell in the rally on Jan. 13, we recommend closing the position at the current levels.
We don’t want to carry a long position when the overall sentiment is heavily bearish because a breakdown of the trendline can extend the fall to 0.00004 levels.
A breakout of the downtrend line will be the first indication that the fall is over.
The market data is provided by TradingView.
