Which resistance levels will be decisive for the weekly LTC/USD, ETH/USD and DASH/USD trends? It’ll be those, where the trends are most likely to change direction.
LTC/USD
One of the predicted scenarios of Litecoin’s price development has played out during this week. $3.25 was a key resistance level, which was broken through and then held by the sellers, after which the price formed a downward trend.
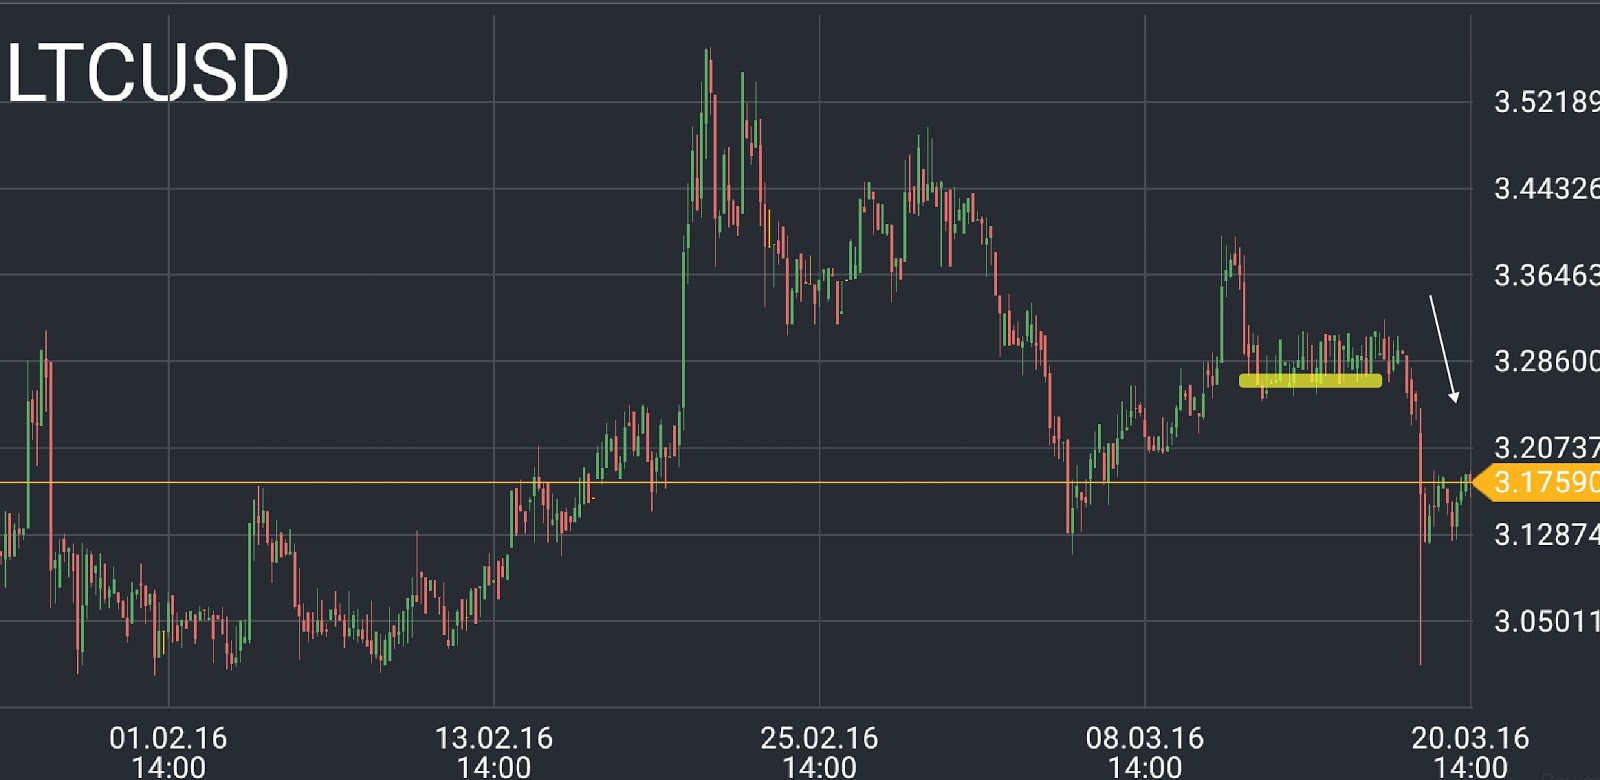
Currently the weekly trend is heading downward. The LTC/USD price is recoiling after a downward trend.
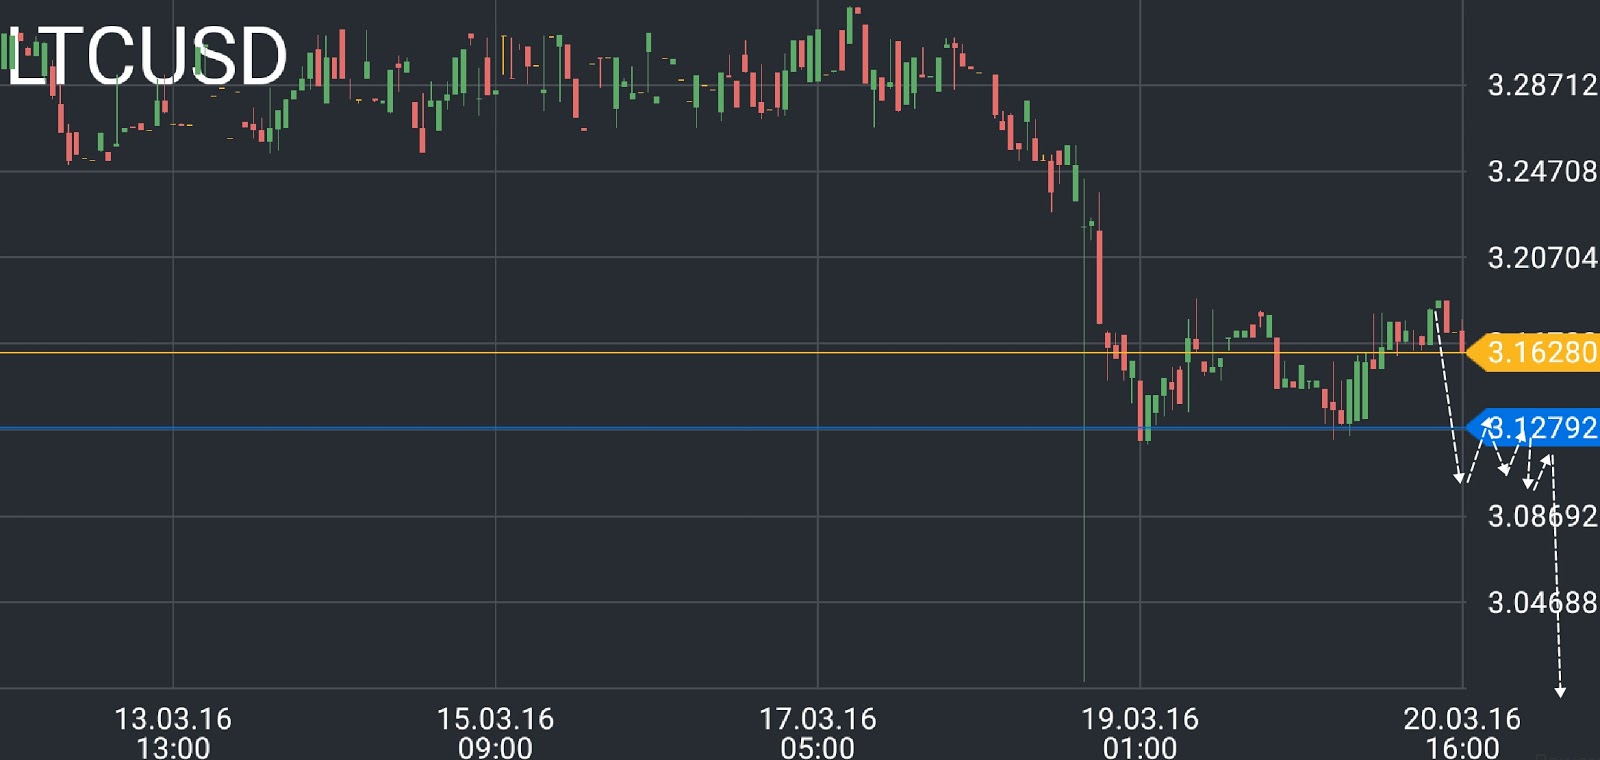
For this movement to continue, the price will have to break through the resistance of $3.12. This point will be crucial for the buyers, and if they are in the minority, the price will keep going down.
If, however, the advantage changes hands and the buyers keep a hold of it at the key level of $3.18, a turn to growth is the most likely scenario.
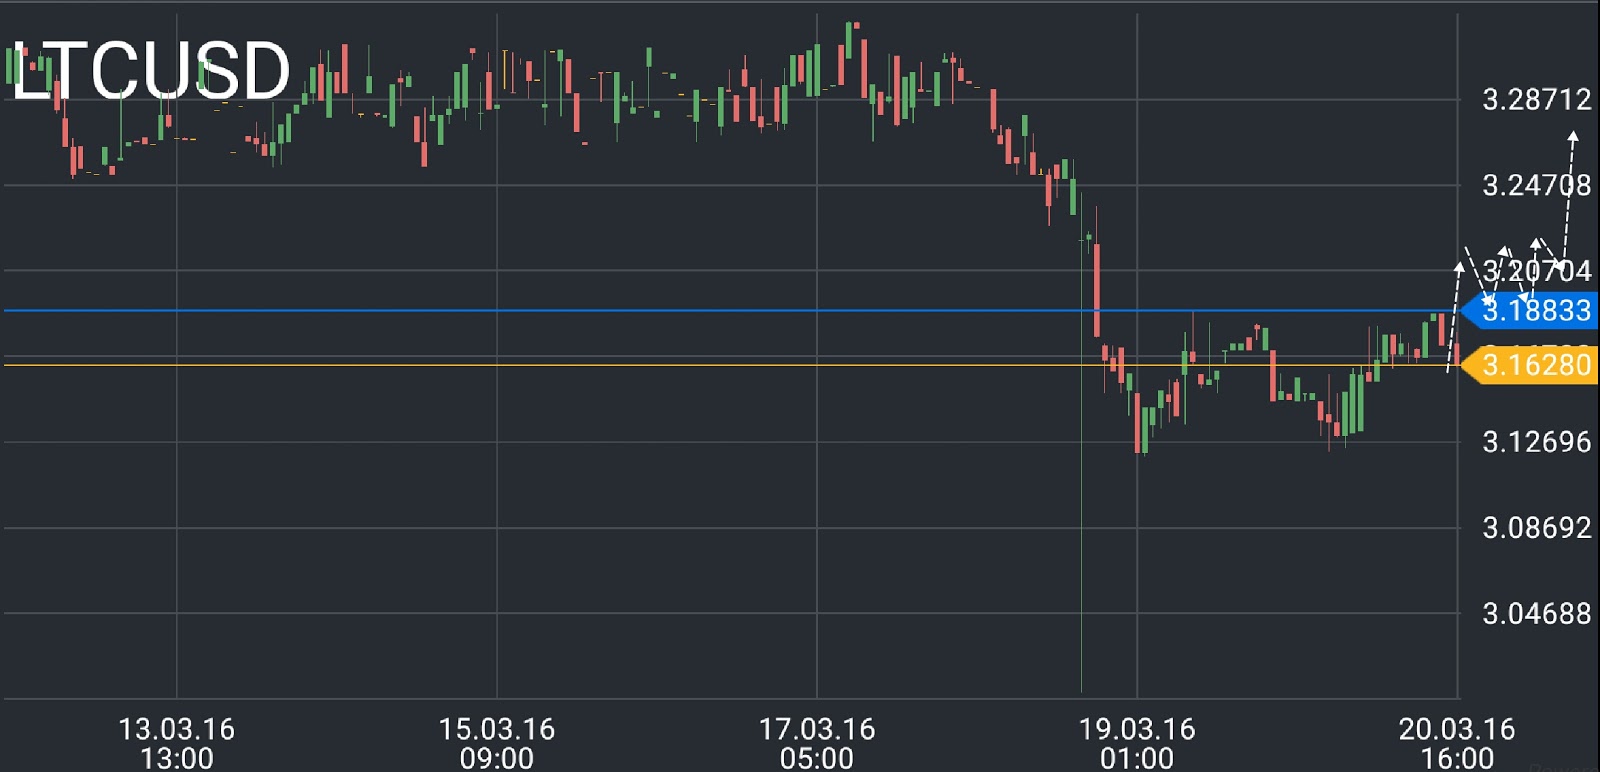
The weekly resistance levels of $3.12 and $3.18 (BITFINEX) are responsible for the further development of the LTC/USD price.
ETH/USD
The ETH/USD price is recoiling towards the downward movement, which happened last week. Whether the market will keep going down or turn to growth depends on the traders’ behavior at the two key resistance levels of $11.8 and $8.6.
For a turn to happen, the ETH/USD price will have to reach the $11.8 mark. In that case, the price will hold at that level, provided the buyers keep acting strong. All that will be a good signal for an upward turn and formation of the third wave.
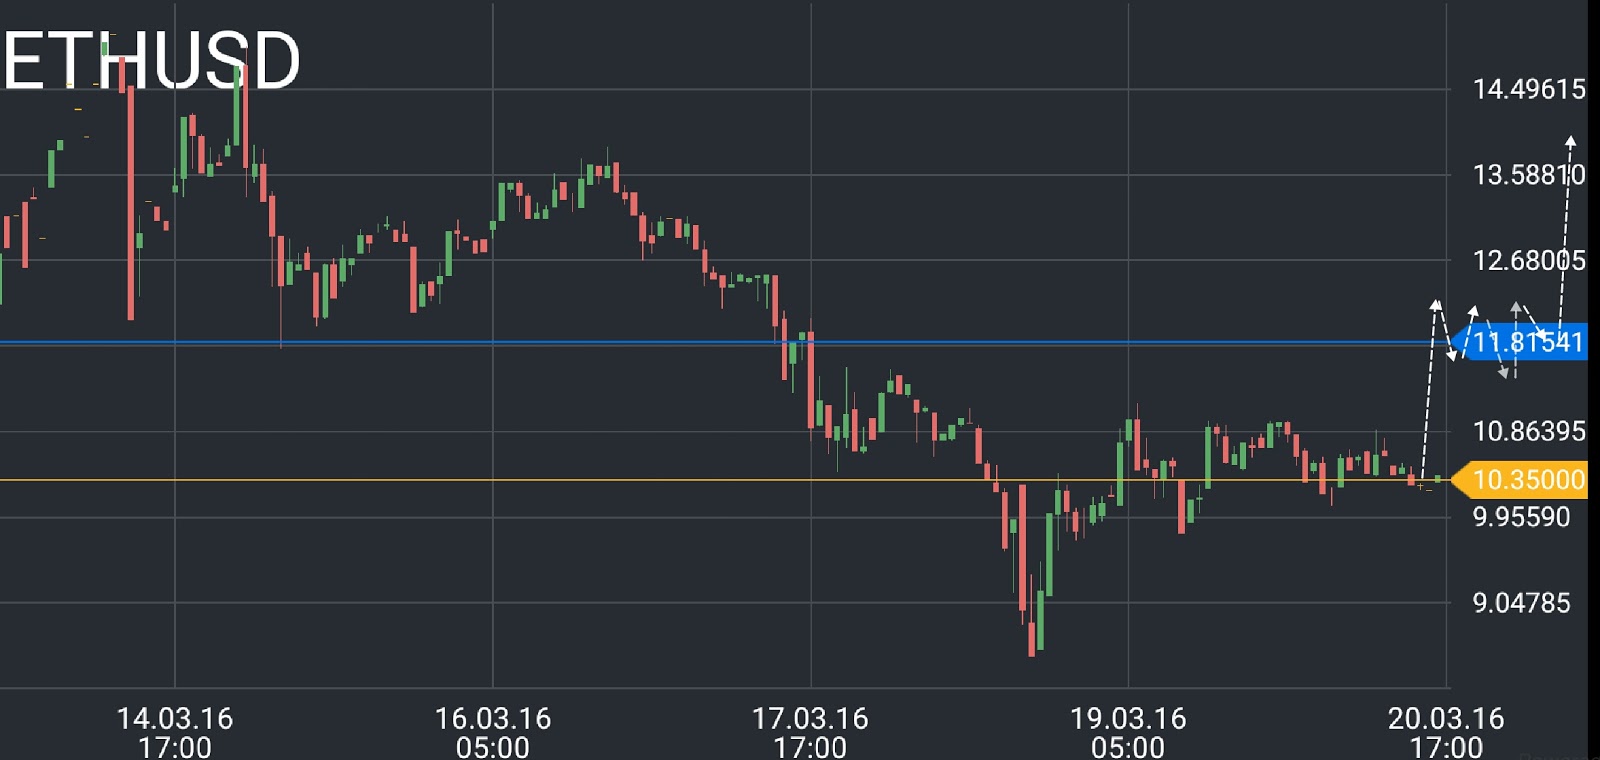
If the buyers are disadvantaged, Ethereum’s price will hold at $8.6 and the downward trend will continue.
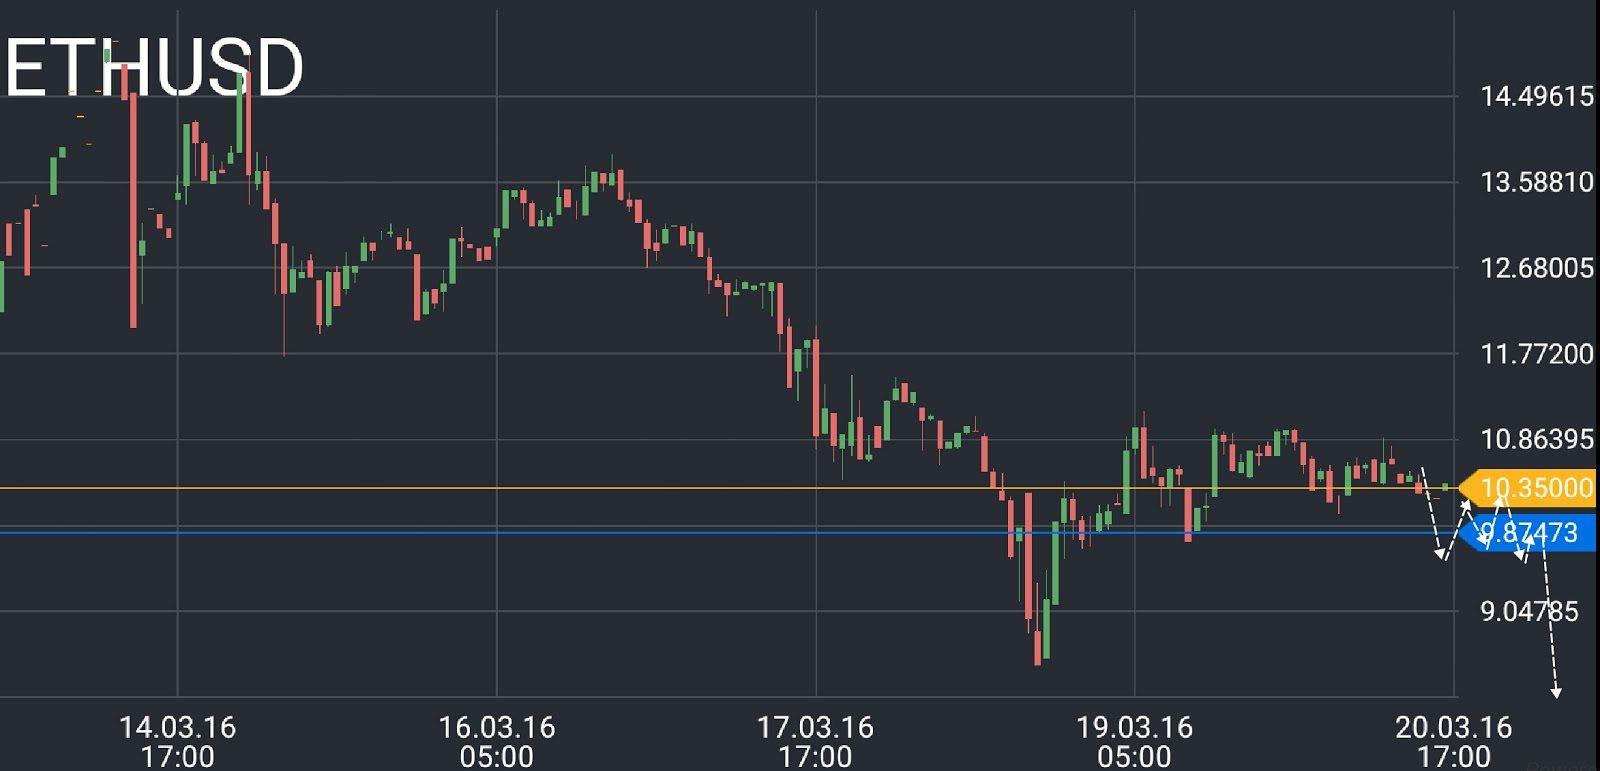
Thus, the two key weekly levels are $11.8 and $8.6 (BITFINEX). They will determine the further direction of the trend.
DASH/USD
The DASH/USD is right now at the historical minimum of 5.95. This mark is also a long-term resistance, which may be the cut-off line for traders’ long-term positions.
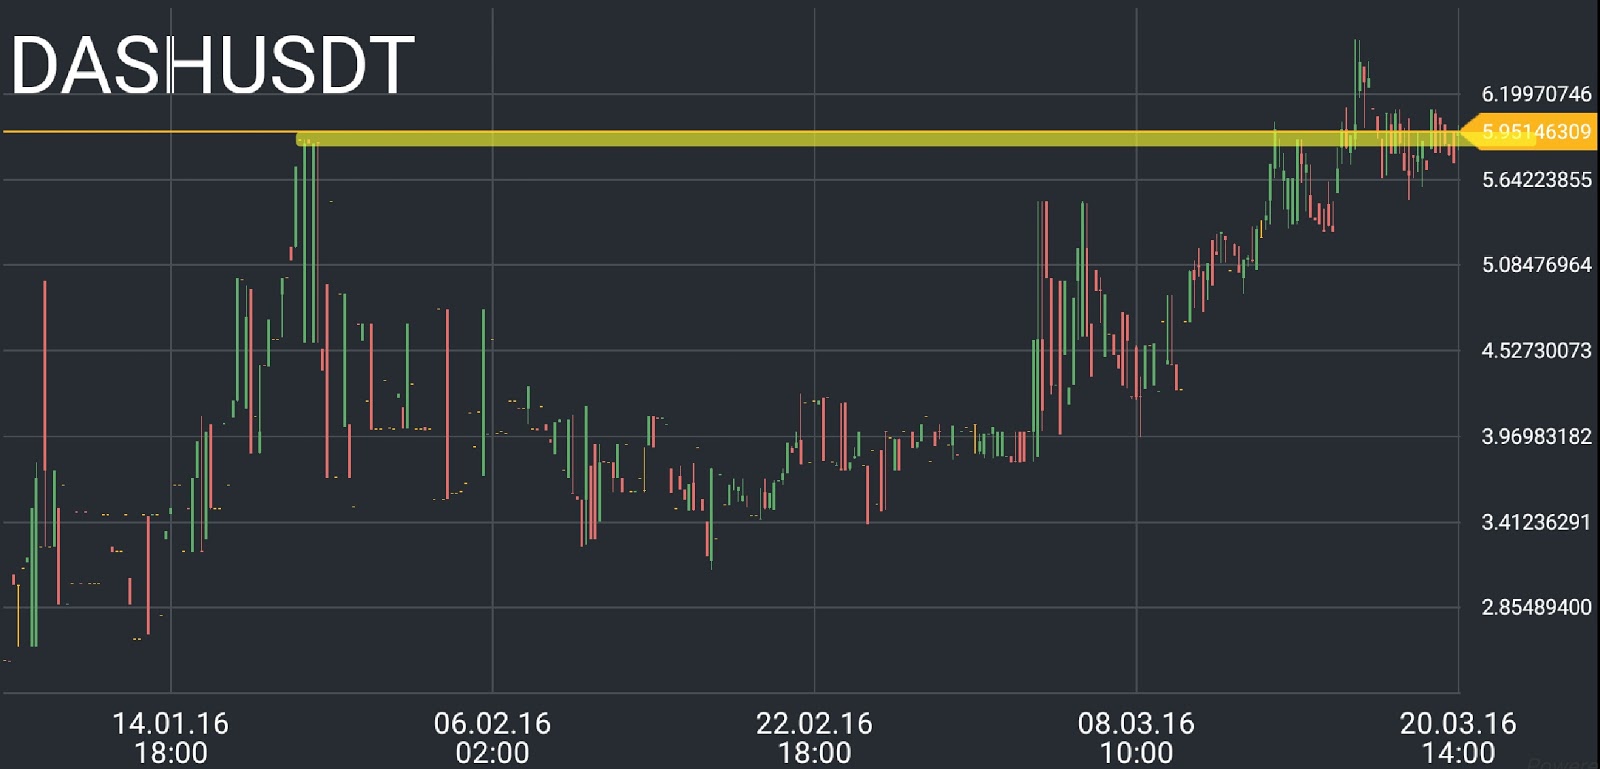
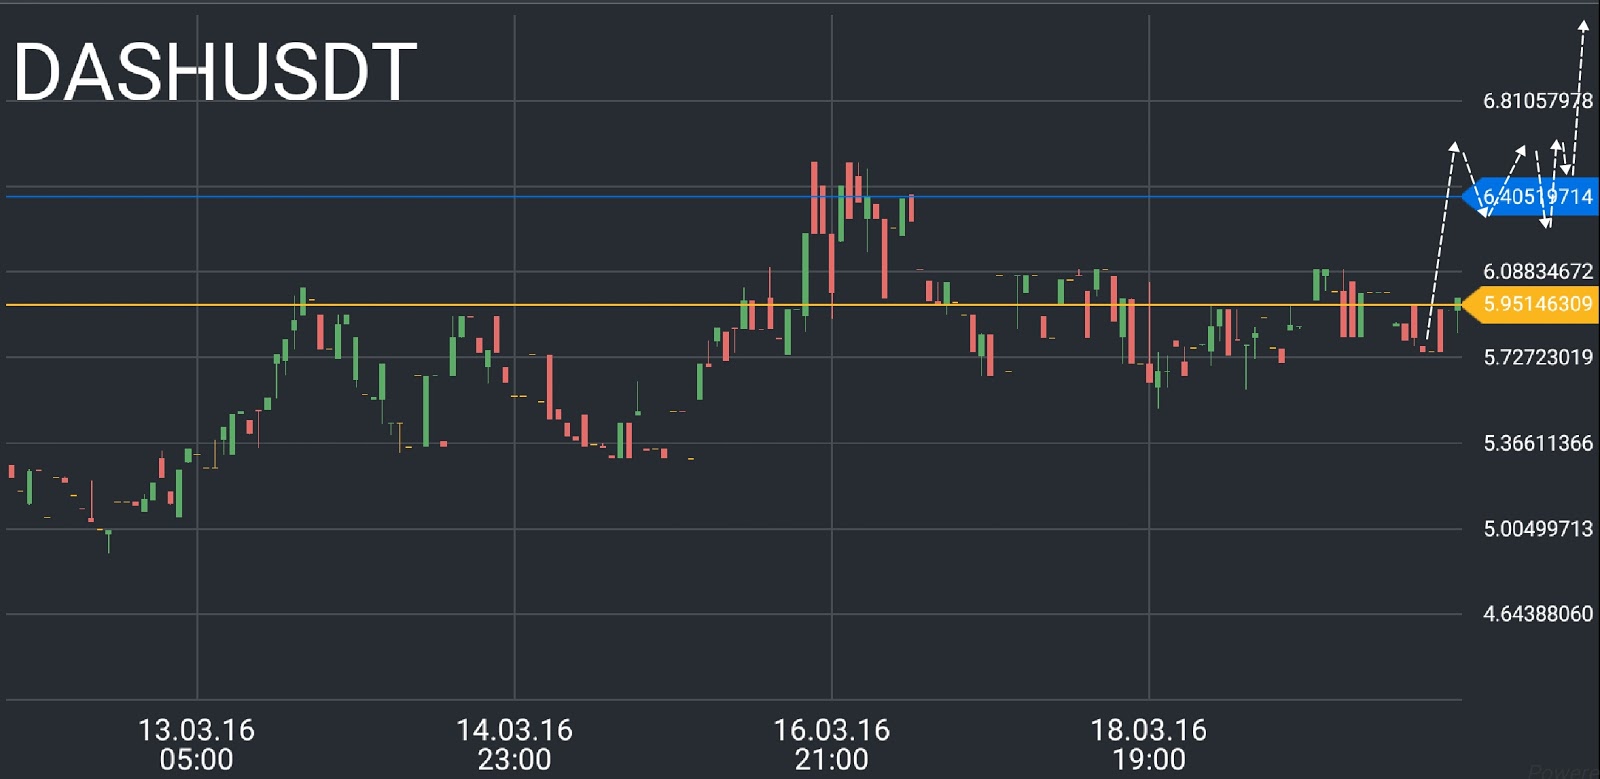
The weekly trend is right now headed upward, but for this to continue, the price has to hold at the level of 6.4.
For a turn to decline, the sellers will have to hold the level of 5.5. In that case, the minimum target will be 4.6.
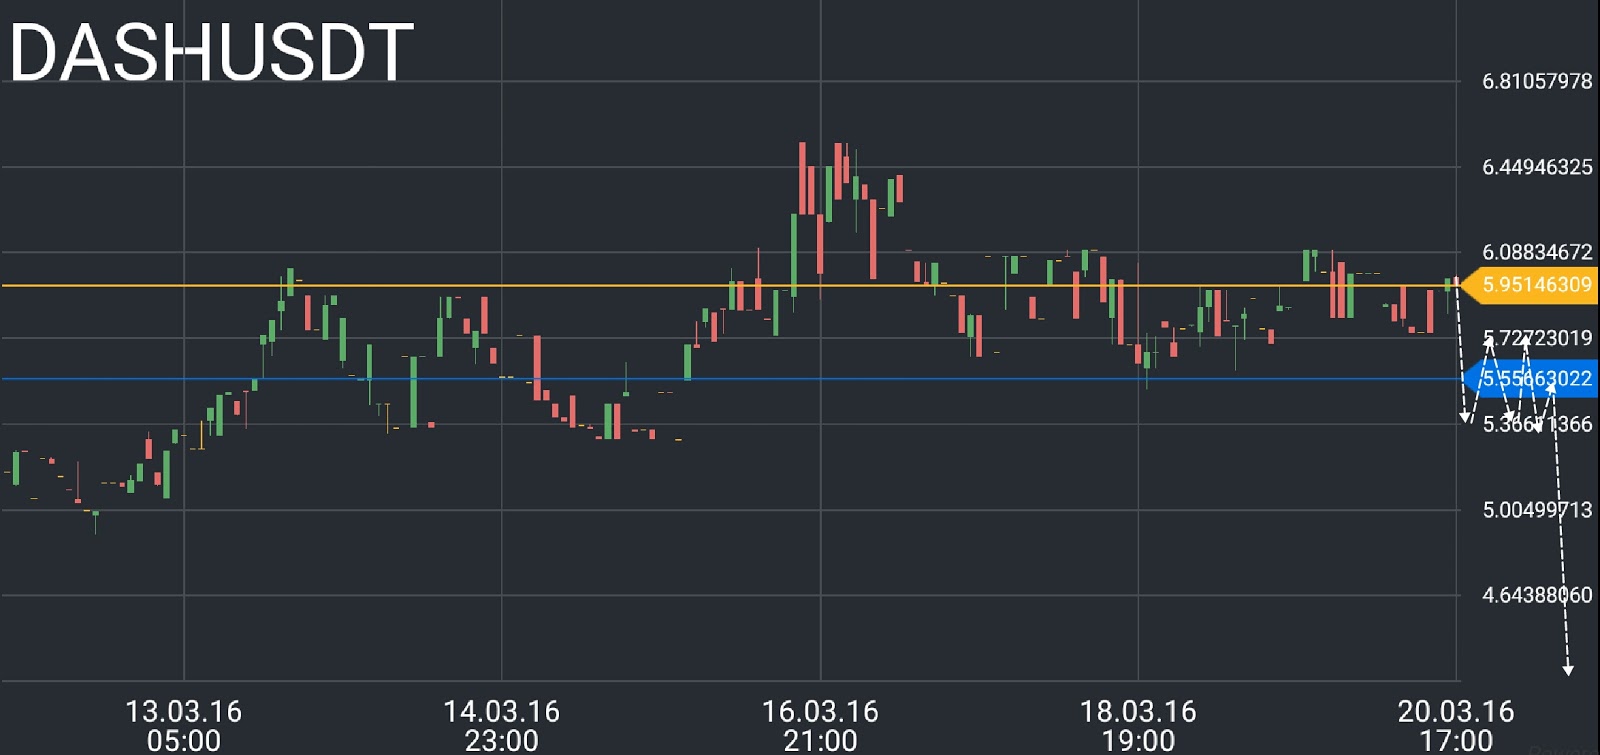
Ultimately, the reaction of the DASH/USD price at the weekly resistance levels of 6.4 and 5.5 (POLONIEX) will determine the further movement.
