Ether’s correction towards the upward trend is nearing its end. A fortification near $10.5 is indicative of the bulls’ strength. Will the growth continue?
Ethereum
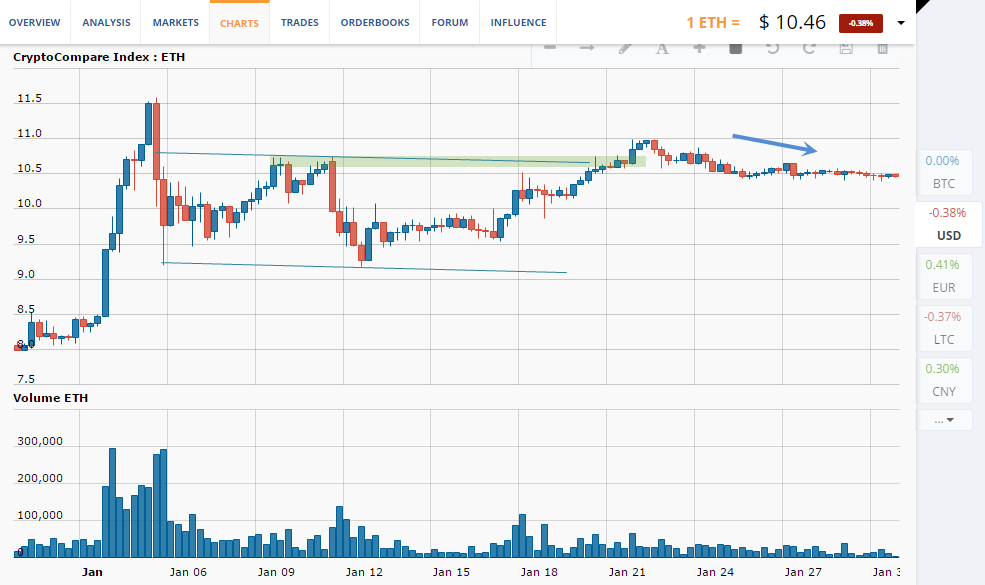
The key line at $10.5 has come into play several times already. In the beginning of January, that mark was profitable for the sellers. The price has formed a flat there, which was followed by a fall. After that, a period of growth came, as well as another rebound from the $10.5 mark. After an upward break through that resistance, the price of Ether has started fortifying beyond that level. The basis for all key levels is traders themselves. The price forms thanks to the buyers and sellers. Consequently, by analyzing the actions of the traders, we can determine the most likely picture of the future trend.

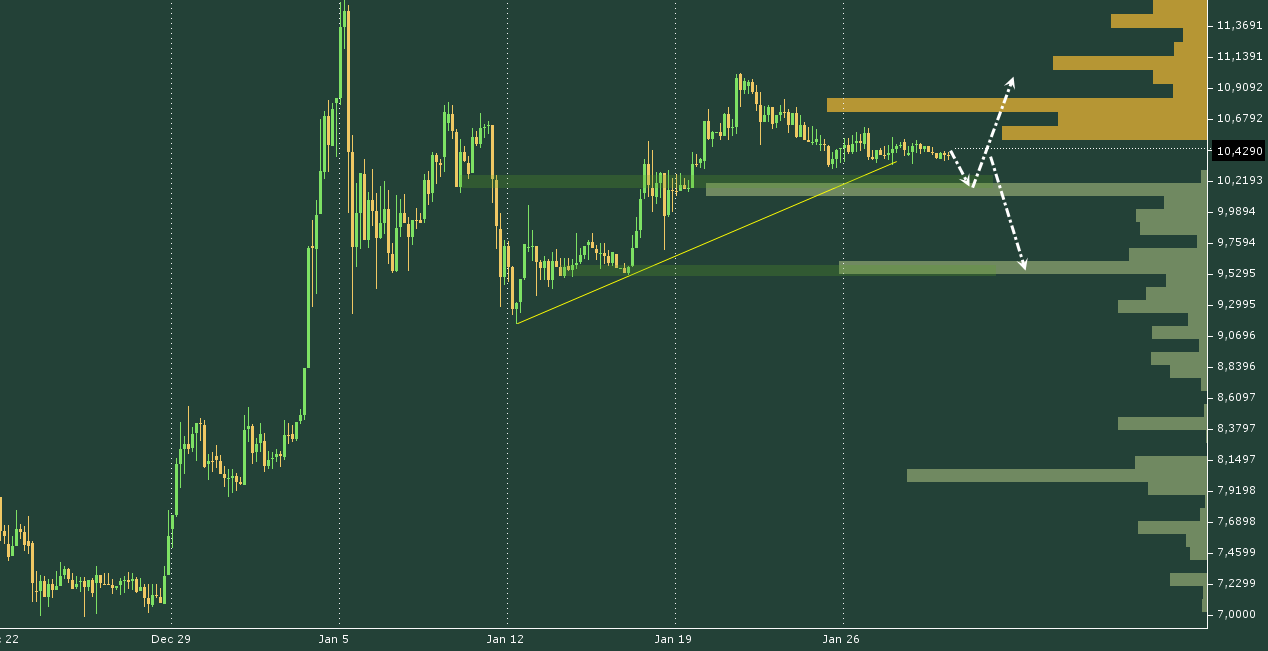
The downward rebound is nearing its end, given how the price of Ether is at a key line. The outcome is close. In order to determine where a key level is situated, we need to know where the majority of traders open and close their deals. In regards to the upward trend from $9, the key mark is somewhere close to $10.2. The diagonal channel, as well as the peak of a turning wave of the previous downward trend, intersect near that point, thereby forming that resistance. All this is confirmed by the concentration of buy stop orders near $10. Thus, the part of buyers which has placed buy stop orders in that area have determined that level to be one of the methods of defining the correction. But the basis of these methods is singular - determining the location of a rebound of a larger scale than all the previous ones. That is why traders, whose deals are situated near $10, expect a continued growth from that line. And it will happen if the buyers manage to hold the advantage.
However, if that is the likely peak of the correction, then it is also the peak of a turning wave. If the price of ETH forms a turning wave at that mark, then the odds will be on the side of the sellers, because in that case, the buyers will not have managed to “hold” a key point. If that takes place, the next stop will be at $9.5 at best. Another part of the bulls will show themselves at that mark, expecting to catch the peak of the medium-term flat, and the price will react to that too.

Ethereum Classic
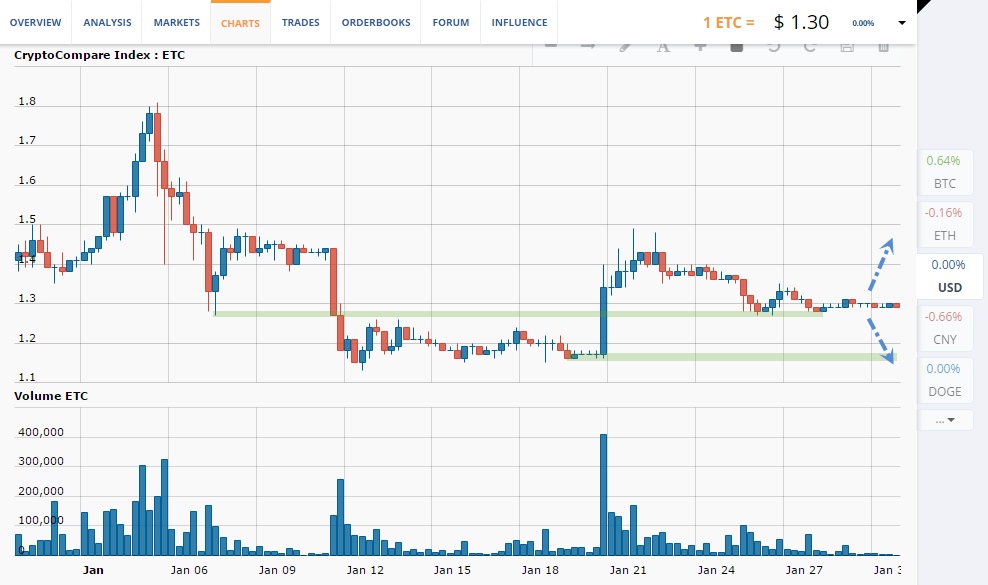
The price of Ethereum Classic continues its downward rebound towards the upward turning wave. Just as with Ether, the correction of ETC is close to its end. The price has stopped inside a flat, at the top limit of the previous flat. As it almost always happens, the volume falls under such conditions. The current price is unprofitable for the vast majority of speculators. That is why the traders are waiting for the outcome.

If a big speculator enters the game, the price of ETC will make false breakthroughs - i.e. after breaking through $1.15 or $1.5, the price will return to its starting point.
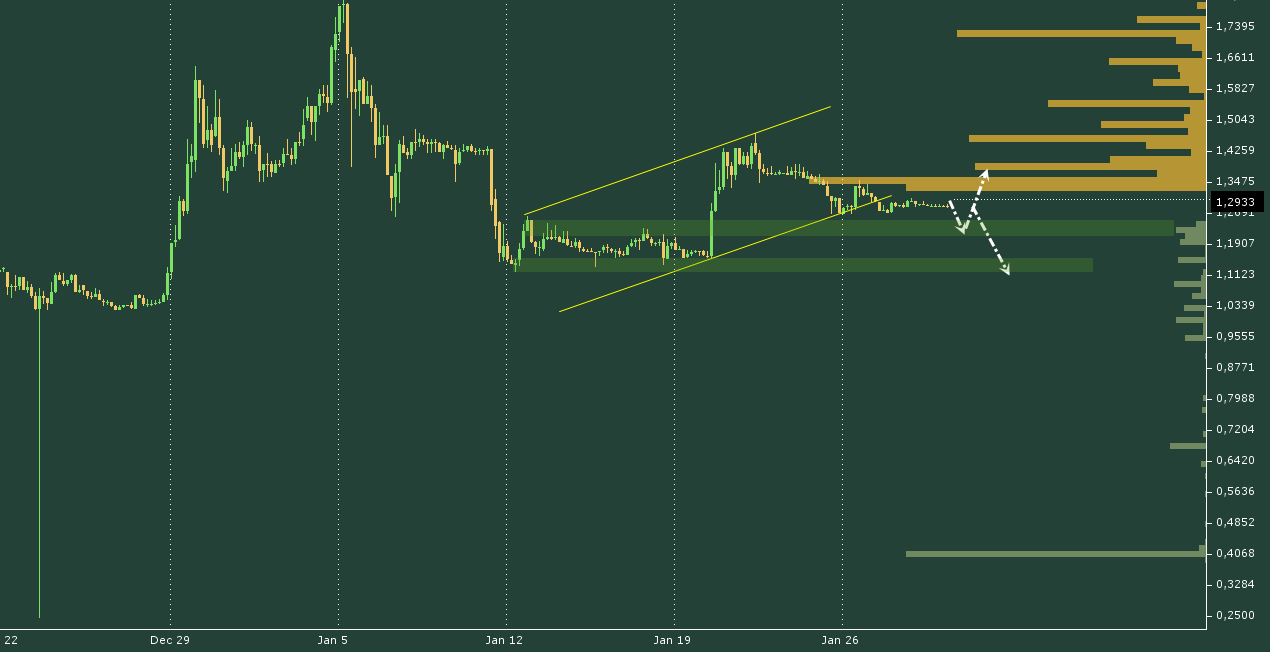
In order for the growth to continue, it is desirable for the price to not go below $1.1 because most buyers have placed their buy orders at that level. That’s why a rebound from that resistance will mean that the bulls are holding the advantage.
Otherwise, the chances are that the downward trend will continue, and the current upward turning wave from $1.15 will turn into a rebound towards this declining movement. The fate of the future trend will likely be decided near $1.15.

Key technicals where a change of trends is most likely:
- The growth of Ether will be more likely to continue if a downward turn doesn’t form at $10.2.
- In order for Ethereum Classic to grow, the market has to refrain from forming a downward turn at $1.19.
