Ethereum price has grown from $130. Does this mean another downtrend correction or a reversal wave?
USDT\ETH
No upward reversal
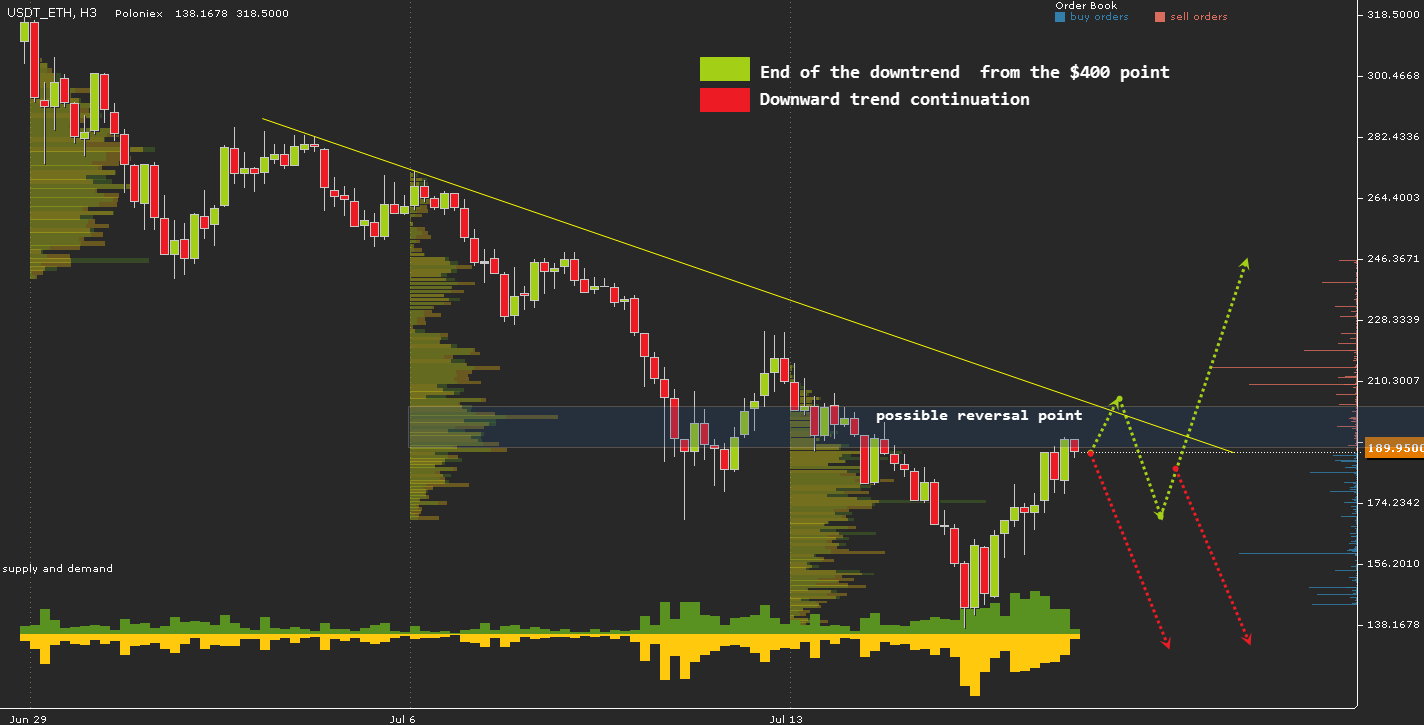
Most Ethereum buyers passed the correction bottom. The exchange rate reaction, an increase in price from $175 to $225, only confirms it. Last week, the key points of where Ethereum was most likely to move were identified. Thus, the $240 level was responsible for the structure of the downtrend. A turn at $240 would give a signal that the structure of the trend is broken and, therefore, the advantage is now on the side of the buyers. It’s the most likely reversal scenario. The fact that Ethereum price reached only $225 and turned indicates that the sellers maintained the advantage.

Uptrend analysis since December 2016
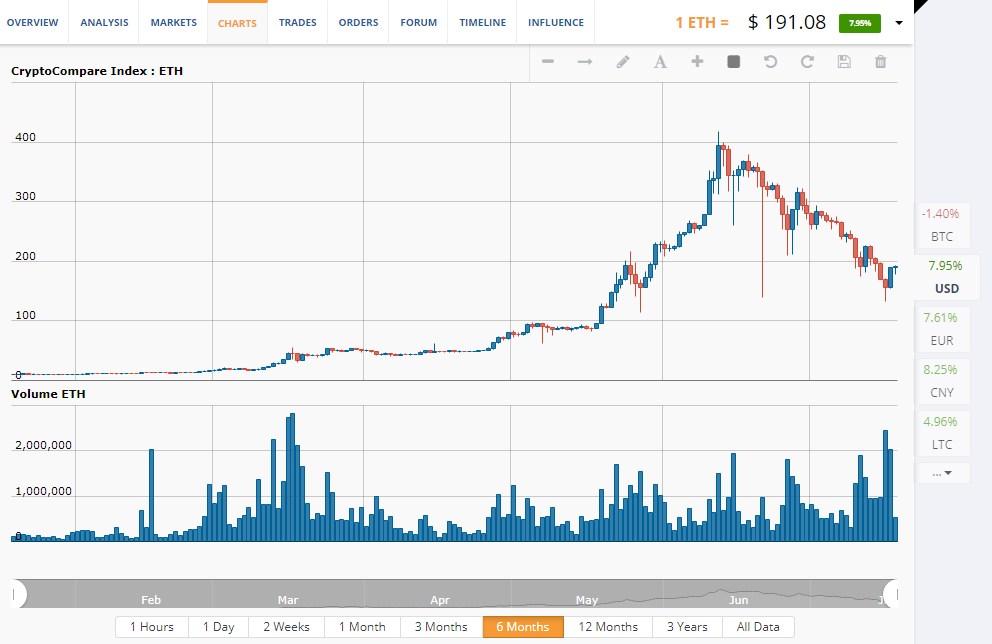
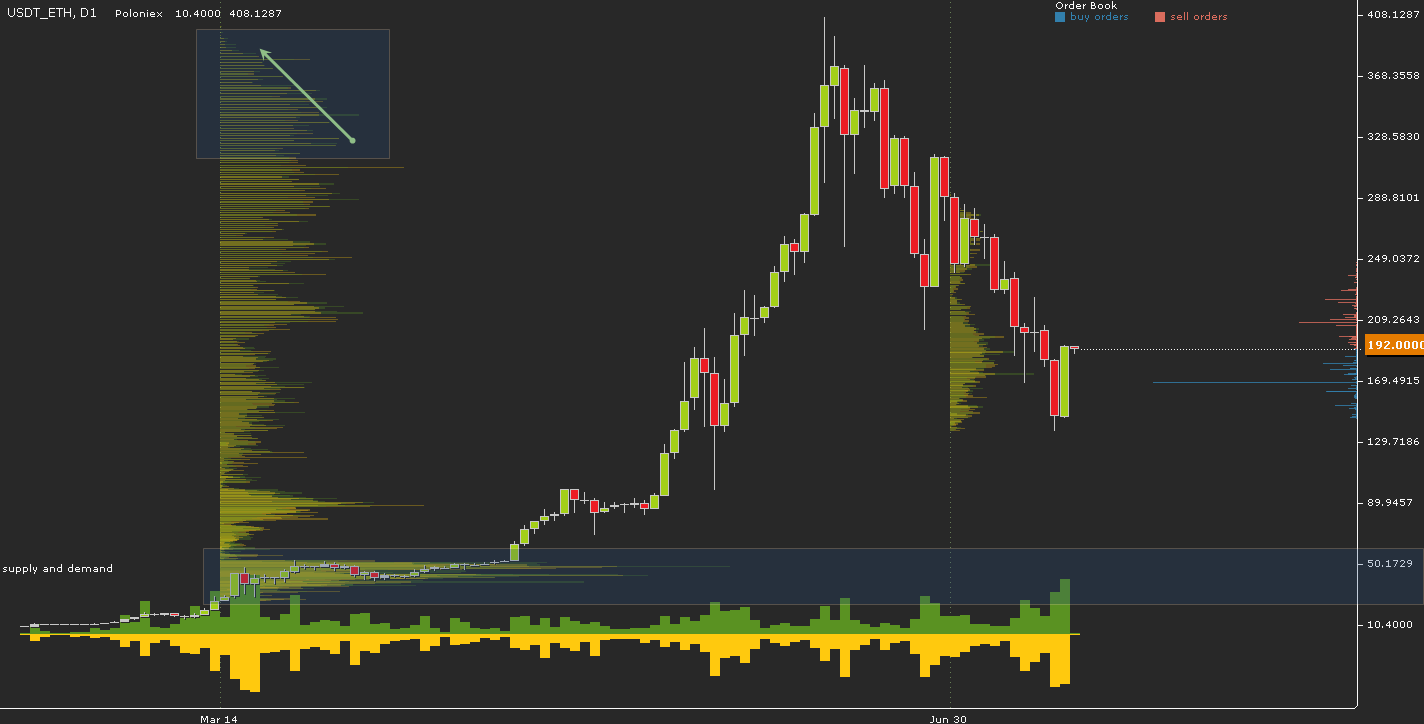
Large-scale correction after the growth from $10 was expected. We observed the first signal at the end of May after the price reached $200 and collapsed by almost 50 percent. The demand was growing, and it allowed for a large trader to invest further. But a sharp drop from $400 ended the trend, that started in December 2016. If we analyze purchases, we can that the main volume of transactions was made at the $20 to $50 range, and from the $300 level, the volume of the purchase began to fall. There was a great demand for Ethereum at the $350 to $400 area, which allowed investors to fix more than 500 percent of the profit.

Current situation
Until the structure of the downtrend is not broken, you should consider any growth as a correction wave. The structure break will indicate the ‘shift in power.’ At the moment, the breaking point of the downward structure is somewhere at $200. The largest order volume for sale only proves it. Therefore, for the fall from $400 to end and the growth to start, at least for correction, requires a turn at this point. If there is no reversal, then the fall is very likely to continue.

USDT\ETC
Ethereum Classic couldn’t hold
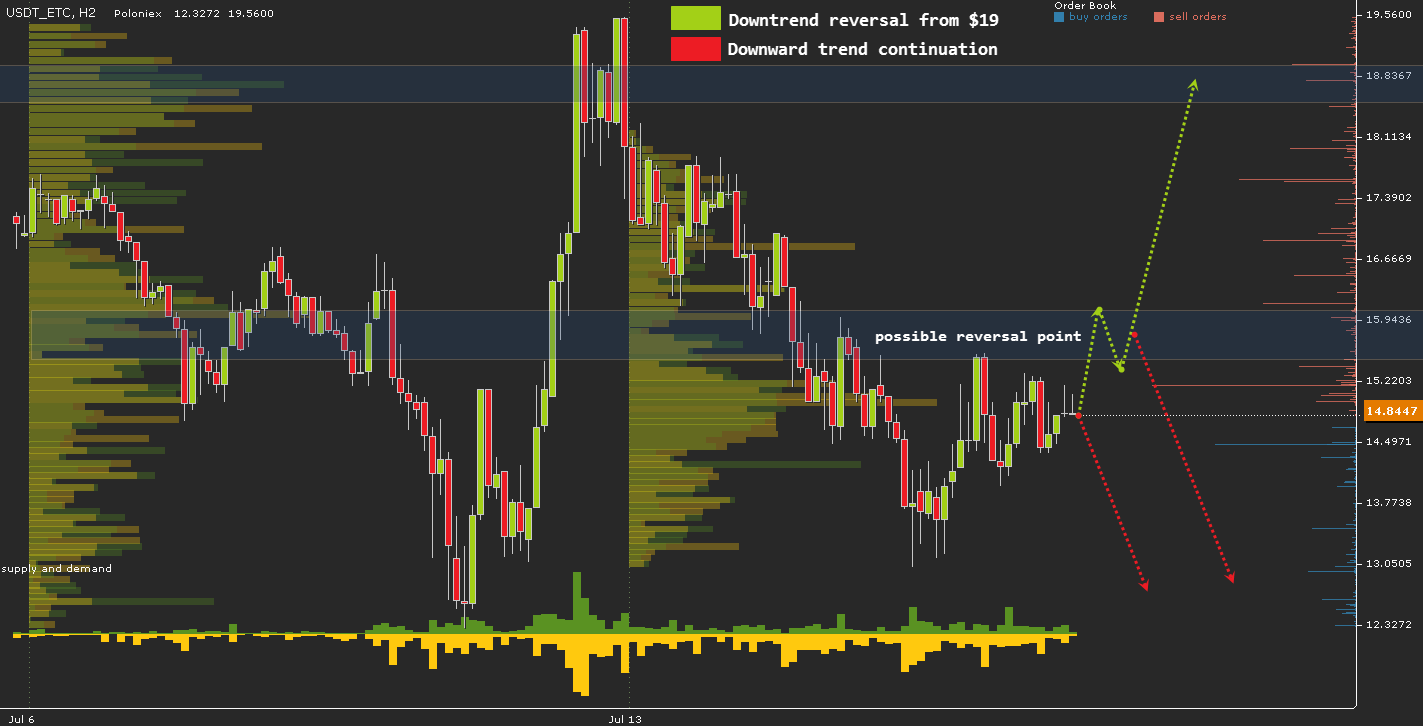
After a rebound from the lowest border of the flat at $13, ETC stopped at the key point around $15 to $16. The course failed to gain a foothold at profitable for sellers zone. As a result, the supply exceeded the demand and Ethereum Classic price continued to go down.

One more increase in volatility
Ethereum Classic is traded at the lowest flat point. That is why there is a high probability for volatility growth since most traders manifest themselves at such key levels. The current $19.5 to $13 flat wave can turn into a reversal wave, where the flat exit from and a deeper fall may follow. But saving the structure is essential in this case. The key point, responsible for the trend structure is $15 to $16. If there is a turn in this area, chances are the flat will go on.

What to expect
USDT\ETH
If there is a $200 upswing, then there is a high probability for a correction of the entire downward trend from $400.
USDT\ETC
If there is a turn up at $15 to $16, then the growth is likely to reach at least $18.
