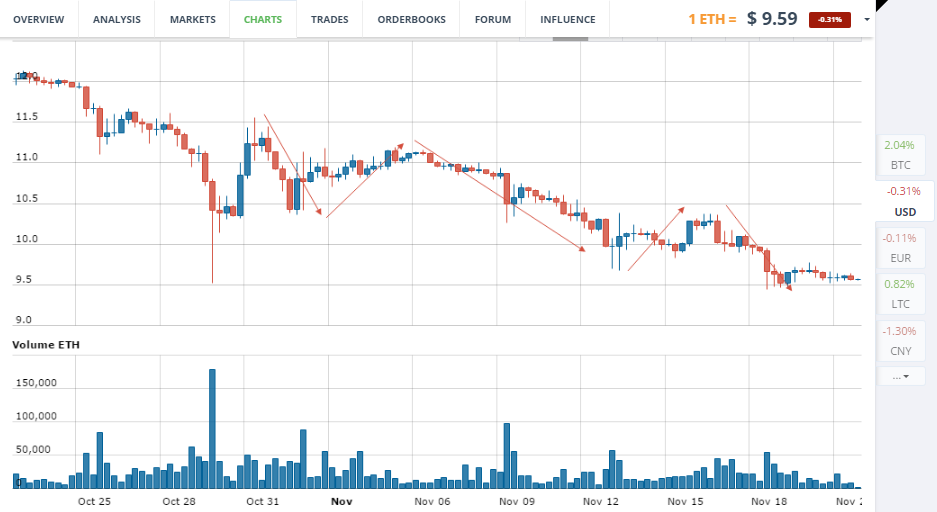
Ethereum’s price is forming the last wave of the short-term downward trend. After this wave ends, the medium-term structure will begin to form. There will be a good chance for increased volatility.
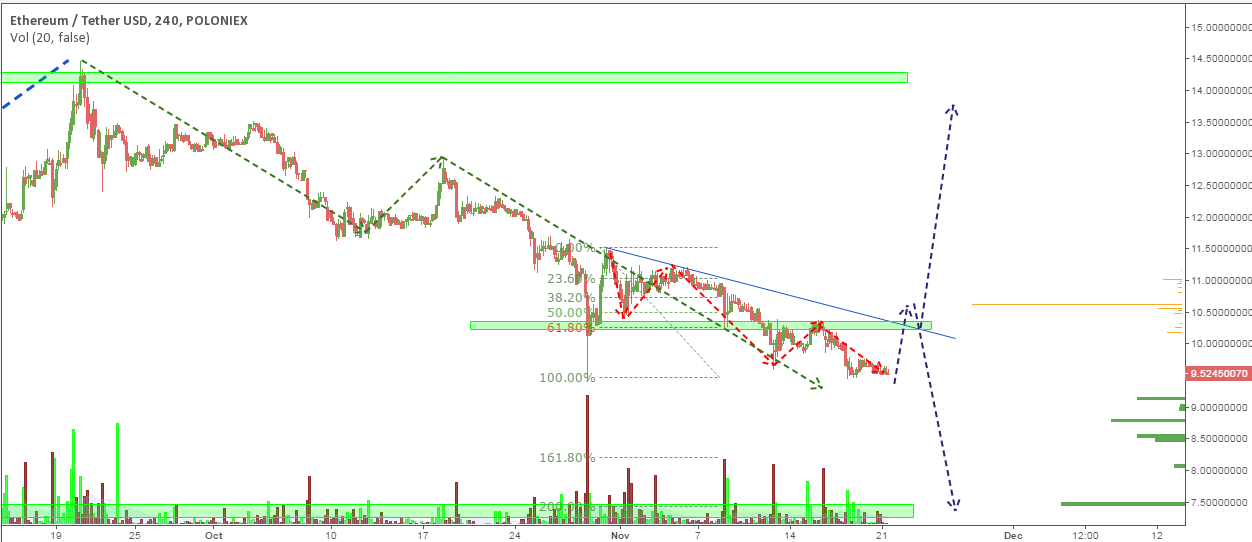
ETH/USD
The first wave of almost any trend is usually formed by big traders. By pouring in big capital, they provoke the mass of small traders into either selling or buying an asset. Trading volume usually falls at key levels of any trend, because the majority of traders don’t know where the price is going to go. Because of that, those that do make the first step are clearly expecting something, and have access to big money. After the first wave, the picture of buy and sell stop orders becomes clearer, upon which one can tell what is the most profitable potential situation for the large player. In our case, the first wave of the short-term trend was between $11.5 - $10.5. After the price has fortified within the second upward wave, the third one has followed, during which the big trader was collecting his profits. The third wave has stopped near $9.5, and now the scenario may repeat itself.

That means that $10.3 is the decisive point, or a key level for the development of the medium-term trend. The basis of the last short-term wave is near that level, which is why it is considered the last one. That is also confirmed by the technicals - the Fibonacci retracement and the diagonal channel are intersecting at $10.3. Thus, in order to grow, Ethereum has to fortify at $10.3 and form a turn to growth. Under such conditions, there will be a good chance for an upward trend towards $13 - $14.

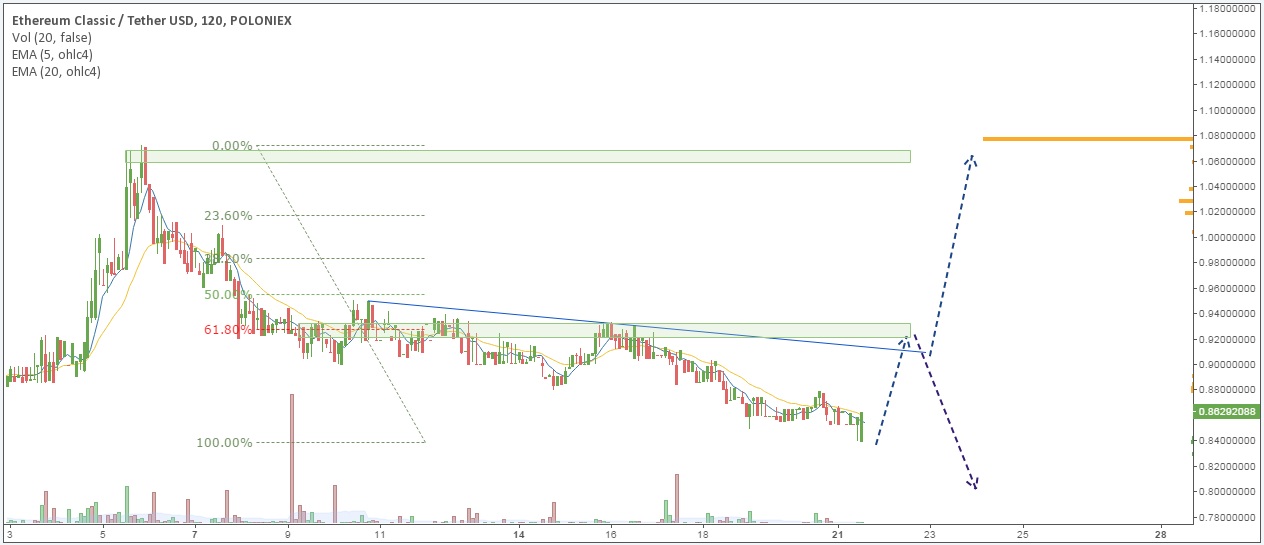
ETC/USD
The downward trend continues. Ethereum Classic is being sold regardless of the fact that the price is currently at its most profitable position, in regards to historical minimums. It seems that the overall sentiment among traders is extremely negative. ETC’s price is approaching the peak of the downward trend, where the bulls may show themselves. That way, there will be a chance for the volatility to grow.


- The downward trend on Ethereum is close to being completed. But for a more likely sign of growth, the price has to fortify and form a turn near $10.3.
- A good sign for growth on Ethereum Classic will be a fortification and a turn near $0.92. Given those conditions, there will be a good chance to reach at least $1.
