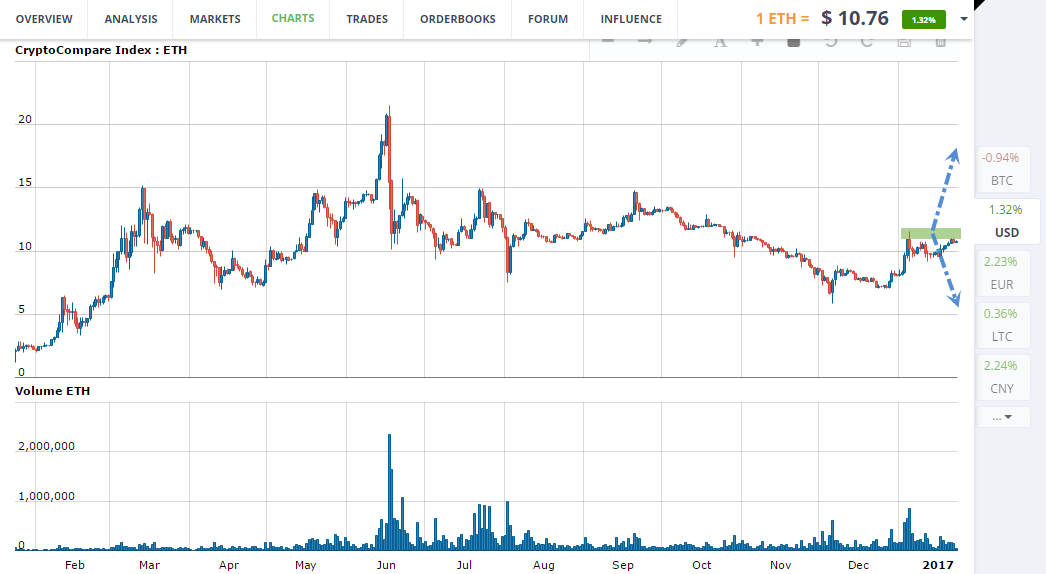
Ethereum is approaching the moment of the truth. The price has reached the most likely peak of the correction towards the downward movement which has started in June 2016.
Ethereum
About two months ago, Ethereum price has reached its long-term key line near $5.8, which can be seen as the likely peak of the correction towards the long-term upward trend. At that moment, the continuation of that long-term upward trend became possible. Today, half of that scenario has already been fulfilled. Ethereum price is at a profitable zone for the bears. That is confirmed by a flat-like movement which has followed a powerful upward impulse. Some bulls, which have opened their deals at a peak near $5.8, are expected to close their deals at levels such as this one. Additionally, the volume of sell stop orders is growing near $11.

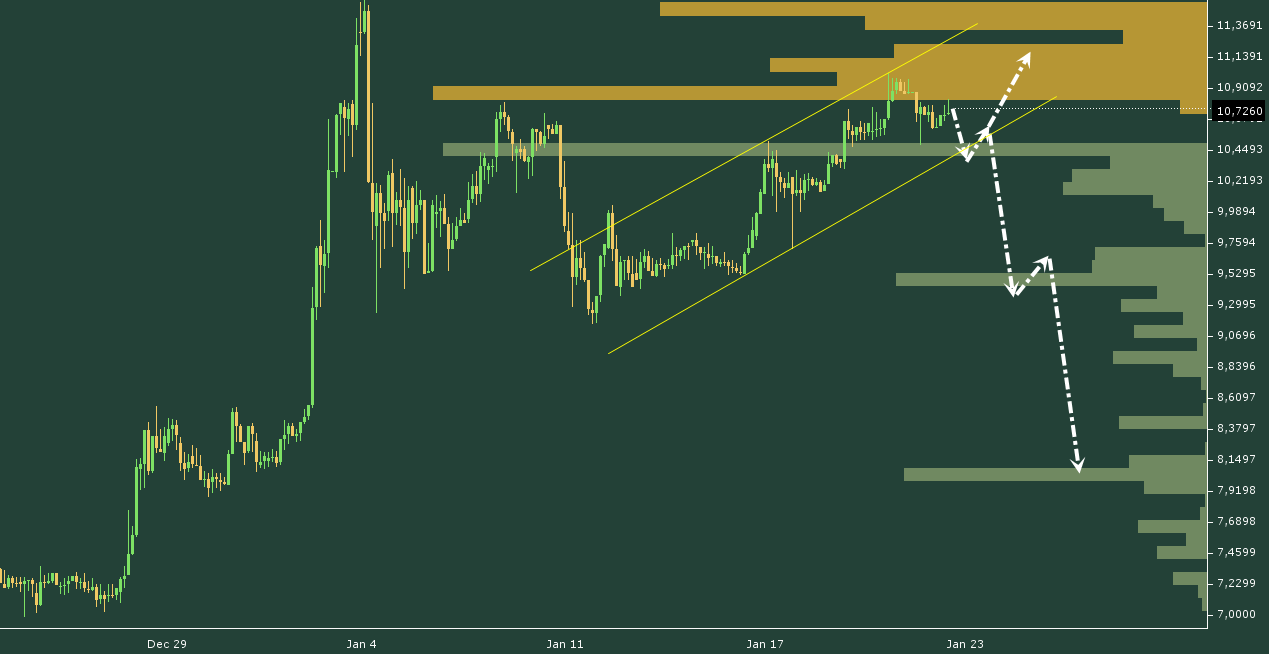
A turn near $9.3 never took place. The advantage was on the side of the buyers. As was expected, Ethereum price has been stopped by resistance in the form of a large volume of sell orders around $10.5. As a result, there was a downward rebound. That is a reaction to a key resistance.
At the moment, we can see the expectations of some traders regarding the future movement of the price. Some of the buy stop orders are situated right below the diagonal channel. That part of traders is clearly expecting a classical rebound from the channel and continuation of growth. That scenario will be more likely, if a turning wave, followed by a downward turn, does not form at $10.4. Other traders have placed their orders in the area of the projected bottom limit of the flat near $9.5. Similarly, for this level, the chances for a rebound and continuation of growth will be higher, if a turning structure does not form at the $9.5 resistance.
In regards to the structure of future growth, Ethereum price is currently inside of a flat. However, given that the price is at the development peak of two possible scenarios a large buyer can enter the game. As we have said earlier volatility grows at key levels. In such moments, the chances grow for both growth and decline. The key is in determining the dominant side.
 Ethereum Classic
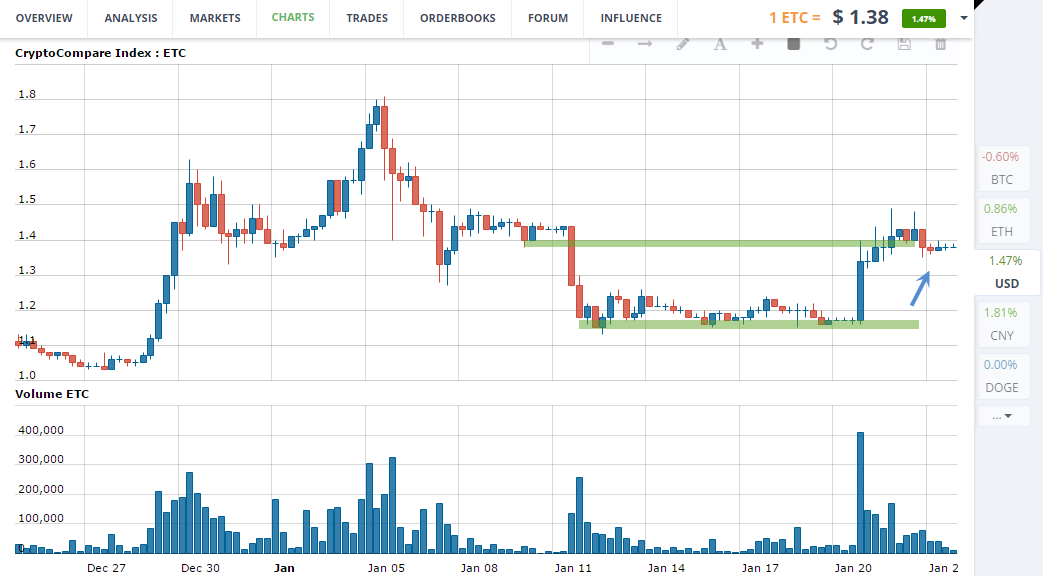
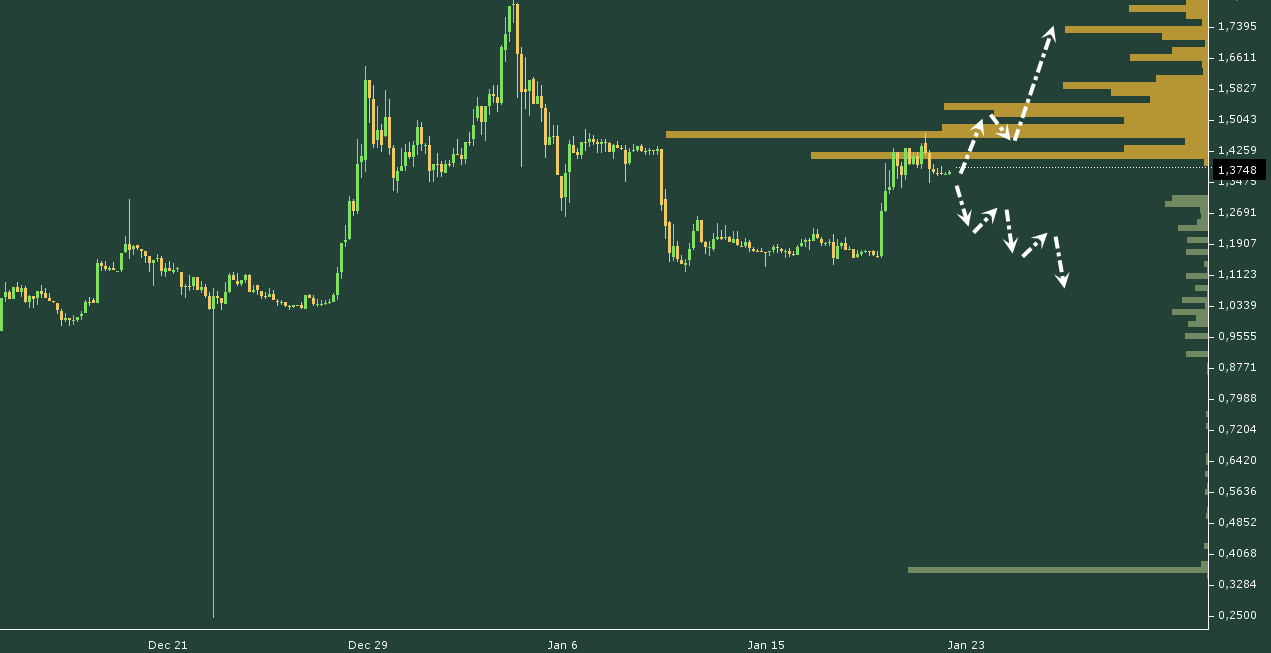
Ethereum Classic is forming a turning wave to continue the upward trend. A downward turn at $1.2 did not take place. ETC has rebounded from a key level and after forming an upward impulse has reached the top resistance of $1.4. We have mentioned the $1.4 mark last week. That point is profitable for the bears. That was confirmed by an accumulation of large sell orders at that level. The Ethereum Classic price is currently fortifying at the mark and the advantage so far is on the side of the bulls.

There are two possible scenarios at the current level, as is always the case in such critical points.
A large volume of sell stop orders is concentrated from here and up to $1.6. This will produce some resistance when the price is on the way up. Due to this, even if growth does take place it will be flat-like. Still, in order for growth to continue, we need to see an upward turning wave in that area coupled with a breakthrough of the $1.6 line. Under such conditions, the upward trend will be more likely. Such a scenario will indicate that the buyers are holding an advantage.
Buy stop orders are concentrated in an area, which is unprofitable for big selling speculators. That is why a sharp falling movement is unlikely until the situation has changed.
 Key technicals where a change of trends is most likely:
- The upward trend on Ethereum, which has started at $9, can be broken by a downward turn at $10.4.
- In order for Ethereum Classic to keep growing it has to form a turn near $1.5.
