In this week’s post we concluded with the following statement
“We are at a very critical juncture right now with the price at US$500. This major support is being heavily tested. We all want the price to stay flat or rise so a reversal here would be ideal. If the price stays below this level for a few days or we start seeing selling into the US$470’s creating new lows, our next level of support is the US$440-450 zone.
“The odds, however, do favor a bounce right here at these levels. The size of this bounce is hard to judge, but we are looking pretty oversold at the moment. Let’s see if the weekend will come things down and we at least come back to the breakdown level of US$560 and re-evaluate the situation then.”
So let’s briefly review what happened and what are the possible expectations going forward. Just to mention one more time, this series is not a trading guide, which is why we do not go beyond daily charts and consider the long-term view of the weekly charts as more relevant. We also attempt to deconstruct news to attempt to gage the long and immediate effects on Bitcoin’s price.

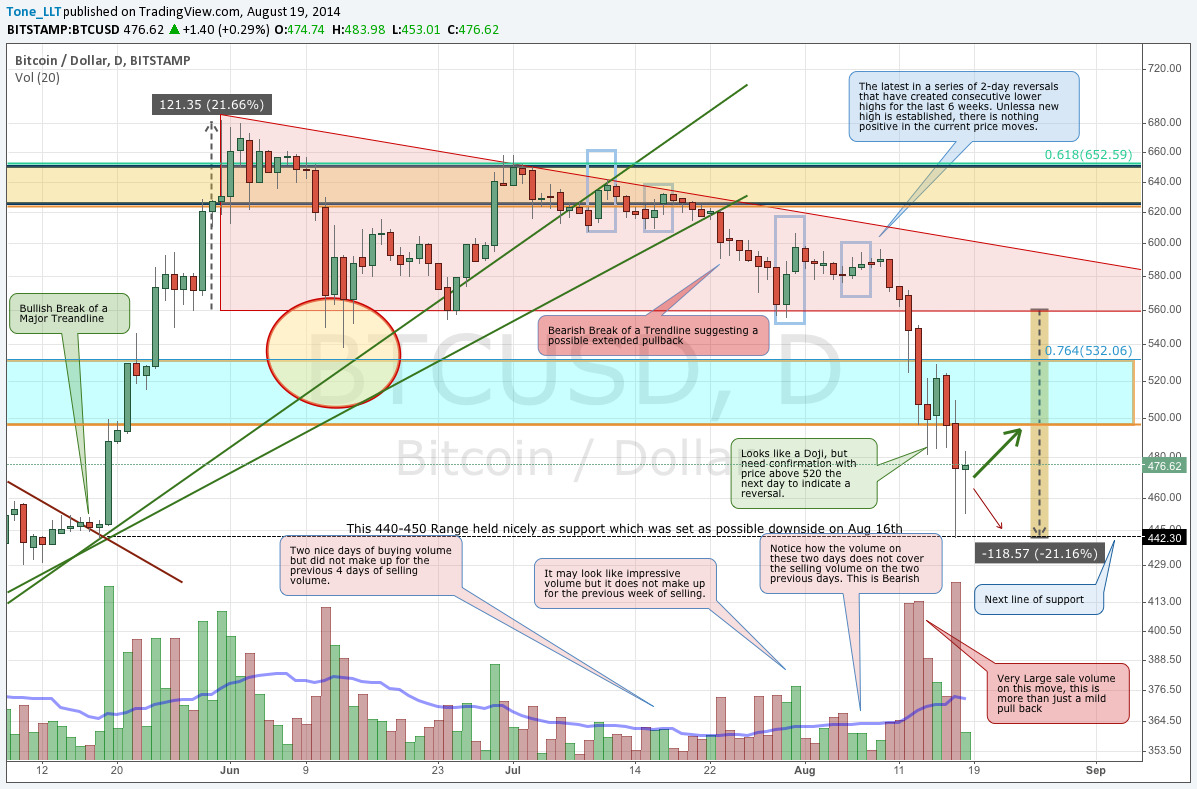
The higher probability was the expectation of some recovery, which started out looking very good. We closed right at the highs of the previous candle and even made a new daily high vs. the previous day for the first time in a week. Unfortunately this bounce was short lived and only made it back to the top of the US$500-530 range that we have been focused on for about a month.
The selling resumed right after and followed the bearish possibility to the letter. Once new lows under US$480 were made, it accelerated quickly to US$442, which we referenced as the $440-450 zone of support. You will also notice that we have perfectly completed the downside target of the descending triangle. The height of the triangle was US$120 and that is exactly how much bitcoin lost in price the last 7 days at its lowest point.
Fundamentals (aka News)
The news that was mentioned last week about leveraged Trading may still be causing an issue. Today we saw another exchange break down and have a significantly lower price than the rest. The culprit this time was BTC-e, which is a European Bitcoin exchange famous for its creators remaining anonymous and just recently added leverage options to their platform.
While the other exchanges only saw a brief moment when price dipped into the low US$440’s, BTC-e hit a low of US$309 and not for a brief second. Those that had cash in the account had enough time to get a computer and buy reasonable quantities under US$350. The price seems to be back in line now with the other exchanges but this is another example of how fragile these markets are.
These news events do not add confidence to those who are trying to understand Bitcoin or to businesses that are looking for stability in the medium of exchange. Having incidents at two exchanges might put some pressure on price in the near future.
Higher Overview
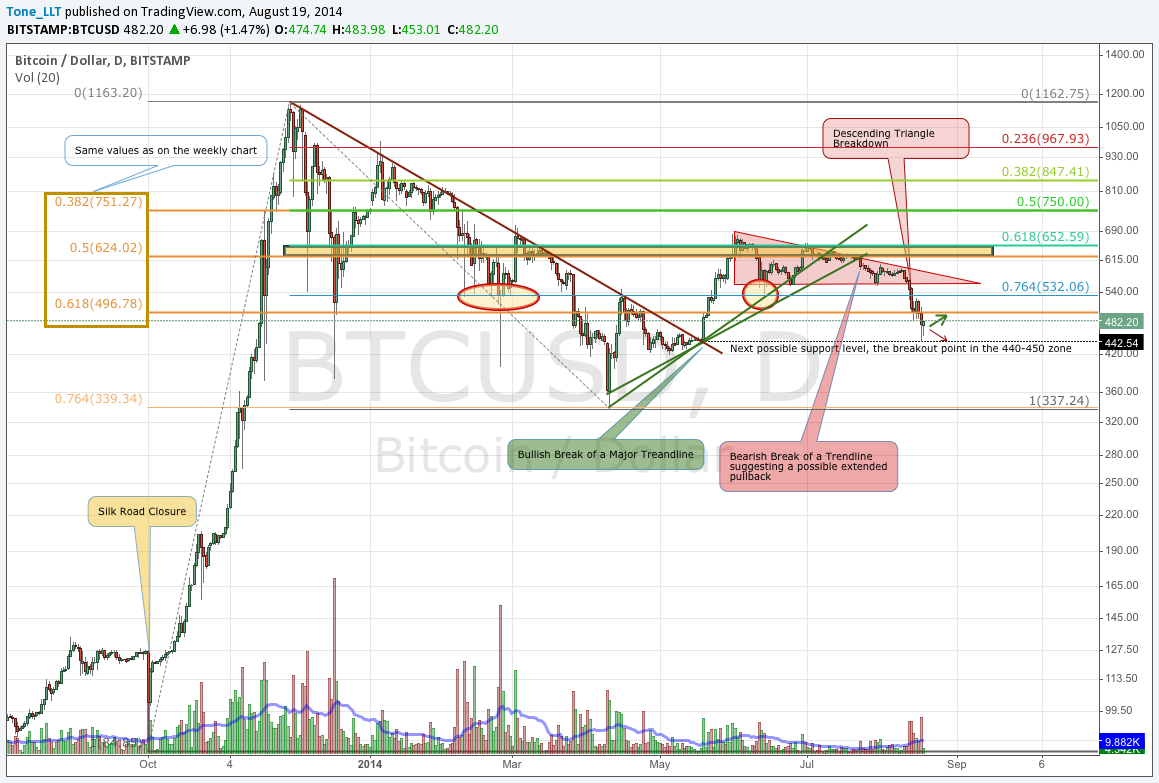
Here is the longer-term daily view where we are still referencing Fibonacci Retracements and a few Trend Lines.

Even though we have bounced form the US$442 mark, it is not enough to consider this a turn in the market. US$442 is now our most crucial point for 3 reasons. It has established a short term low, it was considered a point of support as seen on the chart as that was the price prior to the big may breakout, and most importantly it represent a point below which we would consider Bitcoin to be once again in a long term downward move like the first half of the year.

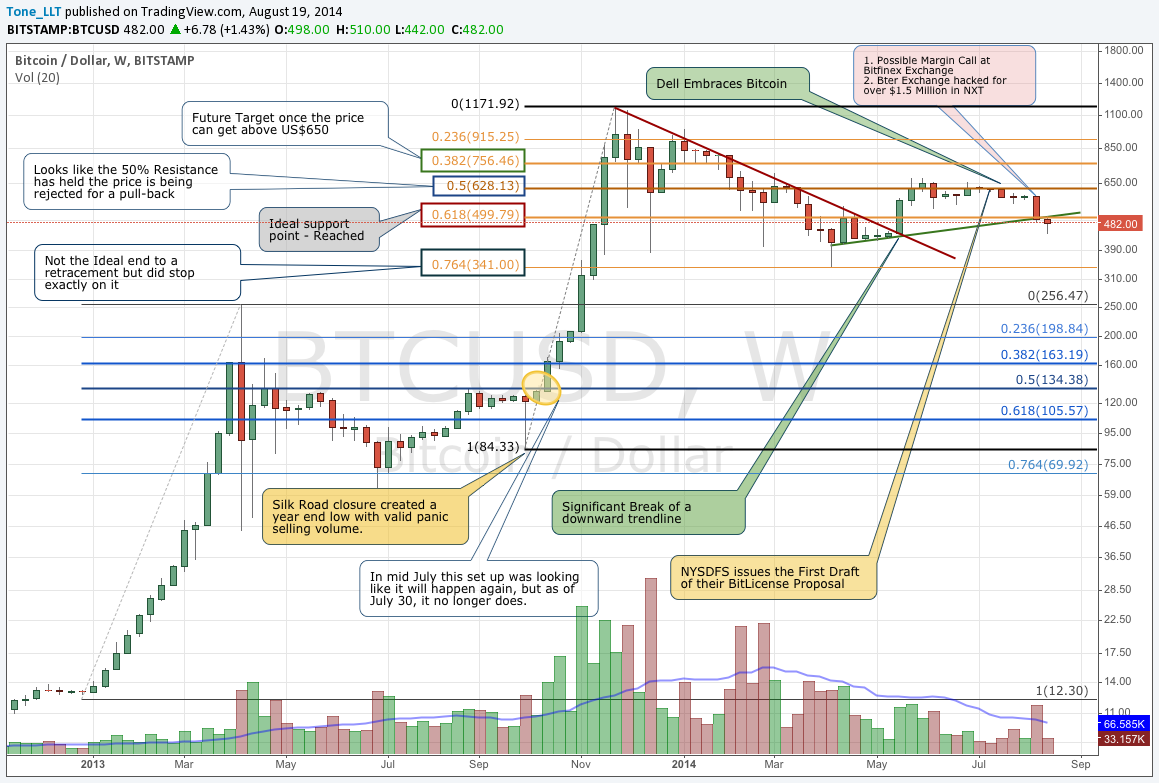
Let us not forget about the most important angle, which is the Weekly chart. The trend line we drew last week connecting the bottoms of the candles has been broken and at the moment there is not much to look forward to in this chart. If US$442 is lost, the next point of support is in the US$340-360 range to create a double bottom with the current 2014 low.
Conclusion
The price is starting to bounce back right now and might be significantly different in a blink of an eye. For the moment we are lowering the bounce target to US$500, which has now become resistance vs. the support it was just a few days ago.
A new range has been established between US$440 and US$500. Allow some time for the markets to settle down and dictate the next move. The long term chart is still considered healthy as long as we remain above this US$440 mark, but in case it give way, look for US$340-360 range as the next line of technical defense. Just like it was said a few days ago, unless faith in Bitcoin is being lost, nothing should go straight down so this oversold condition is due for a bounce even if just temporary, but we have lowered this expectation to US$500 before re-evaluating the situation.
Reference Point: Tuesday, Aug 19 1:30 am ET, Bitstamp Price - US$475
About the author
Tone Vays is a 10 year veteran of Wall Street working for the likes of JP Morgan Chase and Bear Sterns within their Asset Management divisions. Trading experience includes Equities, Options, Futures and more recently Crypto-Currencies. He is a Bitcoin believer who frequently helps run the live exchange (Satoshi Square) at the NYC Bitcoin Center and more recently started speaking at Bitcoin Conferences world wide. He also runs his own personal blog called LibertyLifeTrail.
Disclaimer: Articles regarding the potential movement in crypto-currency prices are not to be treated as trading advice. Neither Cointelegraph nor the Author assumes responsibility for any trade losses as the final decision on trade execution lies with the reader. Always remember that only those in possession of the private keys are in control of the money.
Did you enjoy this article? You may also be interested in reading these ones:
Help Cointelegraph tell the World Health Organization to accept bitcoin to fight Ebola! They have no reason not to take it!
