As we thought would be the case early last week, the Bitcoin markets indeed paused recently to consolidate within the $740 - 780 pivot zone prior to today’s attempt to push above those levels following what was a stagnant weekend for price action. While we think a breakout is coming in the not too distant future, the road to $800 may be slower and more turbulent than most traders expect.
As we get closer to the holidays for many traders around the globe, there are a few fundamental factors that are aiding the technicals in driving prices incrementally higher. First of all, the general time period that we are currently in, which is mid-December through early January, is typically very bullish for Bitcoin from a seasonal perspective. Additionally, failing governments around the world continue to do Bitcoin favors by remaining steadfast in their plans to ban cash or at least large denominations, and this time it’s Venezuela’s turn. Finally, gold is still under selling pressure as the bear market stretches on while Bitcoin continues its steady rise to new highs, a signal to the market that perhaps things are changing. Regardless, these are just contributing factors to what is and has been a largely bullish technical story for the past year.
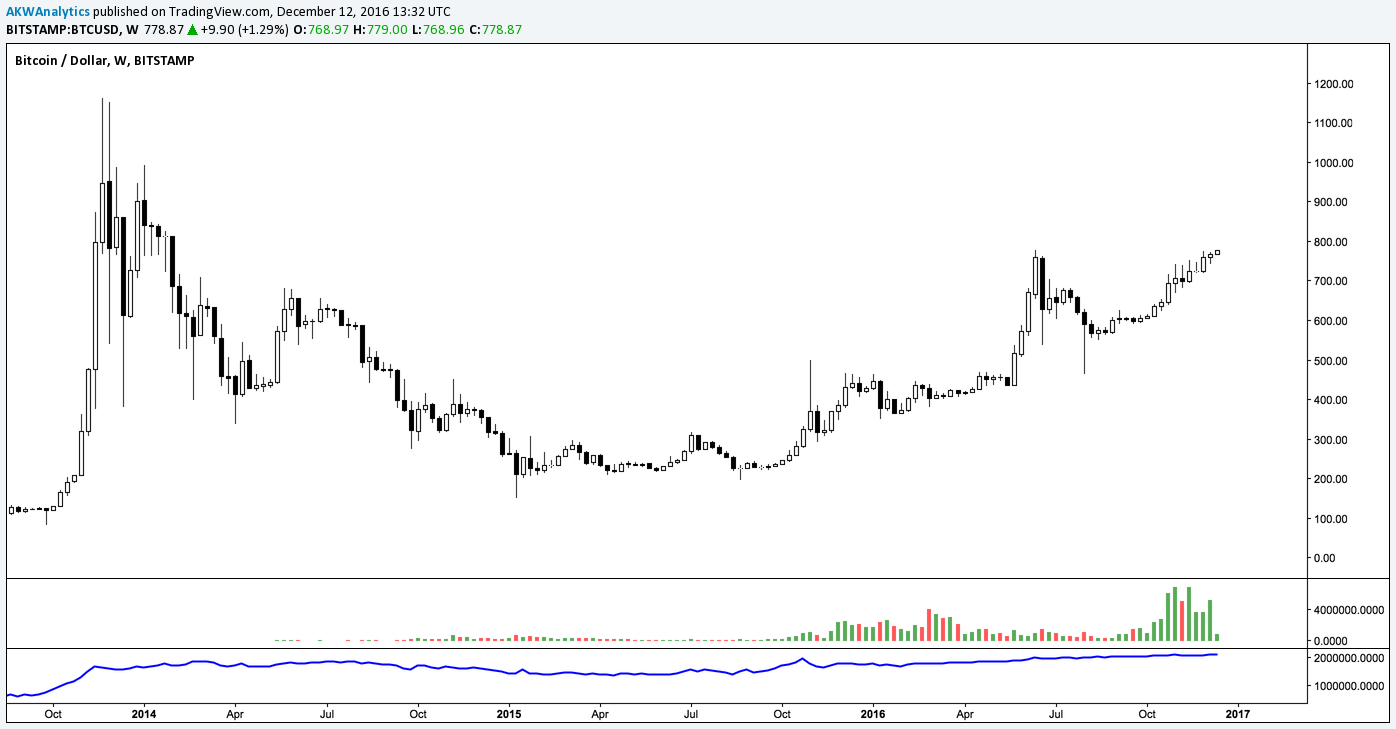
Speaking of the longer-term outlook, we quickly wanted to take a look at a stripped down weekly chart in order to get a better idea of where we currently are in the cycle. No doubt that the frying pan bottom continues to develop as expected, especially considering there is also possible inverse head and shoulders and cup and handle formations that are in play, both of which imply much more upside from the current levels. Also, notice that the market structure is outright bullish, total exchange volumes are certainly confirming the uptrend, and the A/D line continues to head higher, signaling continued buying even at these elevated levels. Overall, we would say that the longer-term technicals remain conducive to a breakout to new yearly highs prior to the start of 2017.

Next, we move on to the daily chart for a closer look at the medium-term setup, given the price is now extremely close to making new highs above $780. Despite today’s nice little move up to the top of the historical supply area, momentum remains overbought while volumes leave much to be desired. Having said that, it also appears as though the price is still inside of an ascending triangle pattern, which typically resolves bullishly, however, this also leaves some room to the downside to test the upper trend line around $740. Although we are not counting on a full retracement back down to those levels, we will be ready for waiting with dry powder in case that does in fact materialize.

- Bitcoin Price Analytics by BBA
Putting all of this together, we think the odds of a breakout sustainably above the $780 resistance level continue to increase with each passing day that price remains above the now key $740 near-term support region. Having said that, we cannot and will not rule out the possibility of a minor pullback to that area, or perhaps even $720, but would use such an opportunity as a last chance to jump in on the long side for a ticket on the train up to and above $800.
BullBear Analytics 15 Percent Discount For Life
BullBear Analytics is the longest standing cryptocurrency forecast service in existence. BBA began posting Bitcoin price reports and updates based on technical analysis via Bitcointalk.org back in late 2010, and has evolved into a buzzing community of savvy and professional cryptocurrency traders. Adam Wyatt (@AKWAnalytics) is BBA’s COO & Chief Analyst.
We are offering a special discount to our Cointelegraph followers so enter ‘BBA15FE’ at checkout for a 15 percent discount on all packages for life! Thanks, and have a great BITday!
Disclaimer: Please always do your own due diligence, and consult your financial advisor. Author owns and trades Bitcoins and other financial markets mentioned in this communication. We never provide actual trading recommendations. Trading remains at your own risk. Never invest unless you can afford to lose your entire investment. Please read our full terms of service and disclaimer at the BullBear Analytics Legal.
