Bitcoin’s growth year on end has been routinely flouted as being over 600 percent, and while that is, of course, an impressive number, it is hard to picture what that means in a market economy.
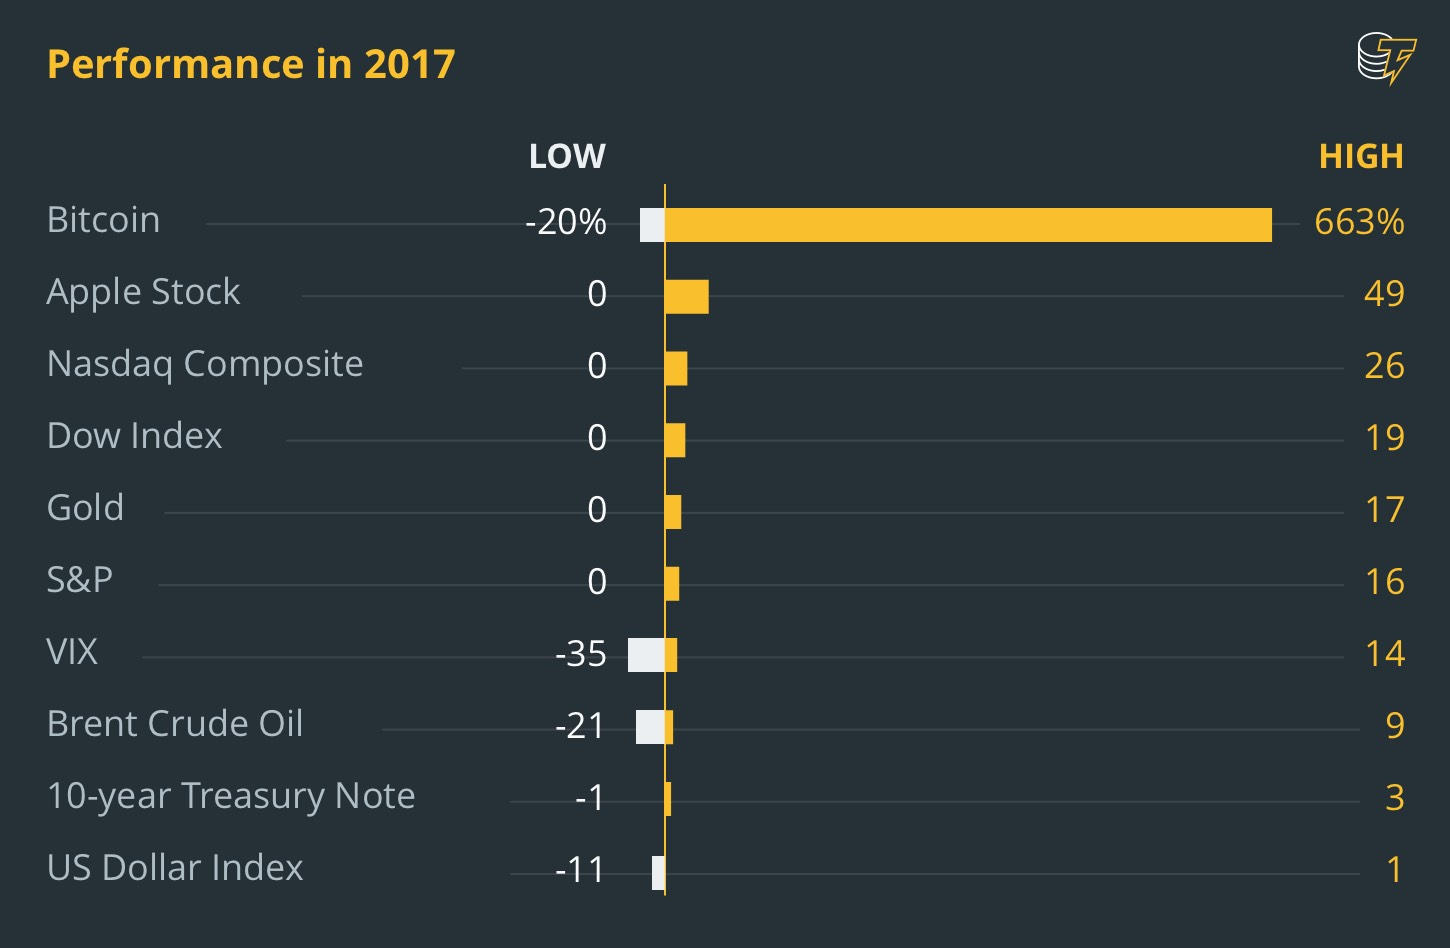
However, when that figure is placed against other big and popular assets, a graph shows the true effect on the growth year-to-date. As it stands, looking at the performance range, Bitcoin ists at 663 percent growth.
Up next is Apple stock which has grown an impressive 49 percent. That figure, of course, pales in comparison, but in any other year without Bitcoin, that would be healthy and impressive.
However, one needs to remember that there have been some big growers across time, and one of those was Amazon, which saw 6,000 percent growth between 1997 and 1999.
In fact, Bitcoin has had better years, 2016-2017 saw the digital currency grow 2,800 percent. But this year, there is no competition.
Off the charts

The graph above shows just how exponential the growth of the digital currency has been to date. The growth has been explosive, but there are also volatile swings that have seen it dip too.
For instance, Bitcoin at the start of the year was a terrible investment as within 10 days the cryptocurrency had lost 20 percent of its value. A better decision, at that point, would have been an index fund tracking the S&P 500, Apple stock or even gold.
There have been some instances where normal assets, such as the entire US Stock market, have suffered big lows. In 2008, during the financial crisis, their stock market fell by 40 percent and it was considered a massive disaster.
However, Bitcoin has dropped 40 percent on more than one occasion already this year, and despite that, the graph still shows its enormous growth.
Bitcoin is like nothing else on this chart, and thus, when figures like 663 percent are thrown around it is hard to quantify or even imagine.
