Bitcoin price soared last week to break out of the bearish trend that has been controlling the market since November, 2014.
Last Friday, the price breached the US$256 resistance level that has been rather immune since a high of around US$268.55 was scored back on February 15.
To better understand the market's trend before the bullish rally took over, we shall analyze the 4 hour Bitfinex BTCUSD chart (see: chart below).
Bitcoin price seems to had been trading along a triangle-like pattern that extends between 3 crucial price points as shown by the green trend lines on the below chart. To understand key support and resistance levels during this period, we can plot Fibonacci retracements along a trend line that extends between the low reached on February 10 (US$214) and the high recorded on February 15 (US$268).
The price rose above the resistance level coinciding with the 56% Fibonacci retracement level at around US$256 last Friday. However, after reaching a high of around US$263, the market attempted to correct price by pulling it down again to touch the 48% Fibonacci retracement level at around US$247, which supported price, and reversing the price correction downtrend.
At the time of writing of this article, bitcoin’s price resumed rising to break out of the 56% Fibonacci retracement level to record a high of around US$267.
I like to use the "William's Alligator" indicator to confirm the presence of a bullish wave. William's Alligator is widely used on Metatrader Forex charts and it is an indicator that consists of 3 smoothed moving averages as shown below:
- The Jaw: it is a 21 period smooth moving average SMA and it takes a blue color.
- The Teeth: it is a 13 period smooth moving average and it takes a red color.
- The lips: it is an 8 period smoothed moving average and it takes a green color.
The Alligator is hungry and opens its mouth when the red SMA rises on top of the blue SMA and the green SMA rises on top of both. This alignment of the 8, 13 and 21 period SMAs signals an upcoming bullish wave.
“[…] we predict that BTC price is likely to rise to test the next resistance level at US$300 next week.”
If you study the below 4 hour BTCUSD chart, you can notice that the SMAs of William's Alligator had showed a bullish alignment right before the price rose on 3 occasions during the past 3 weeks. Accordingly, the William's Alligator can be used to predict future bullish trends during the upcoming week. Right now, we can also spot a bullish alignment, so we predict that BTC price is likely to rise to test the next resistance level at US$300 next week.

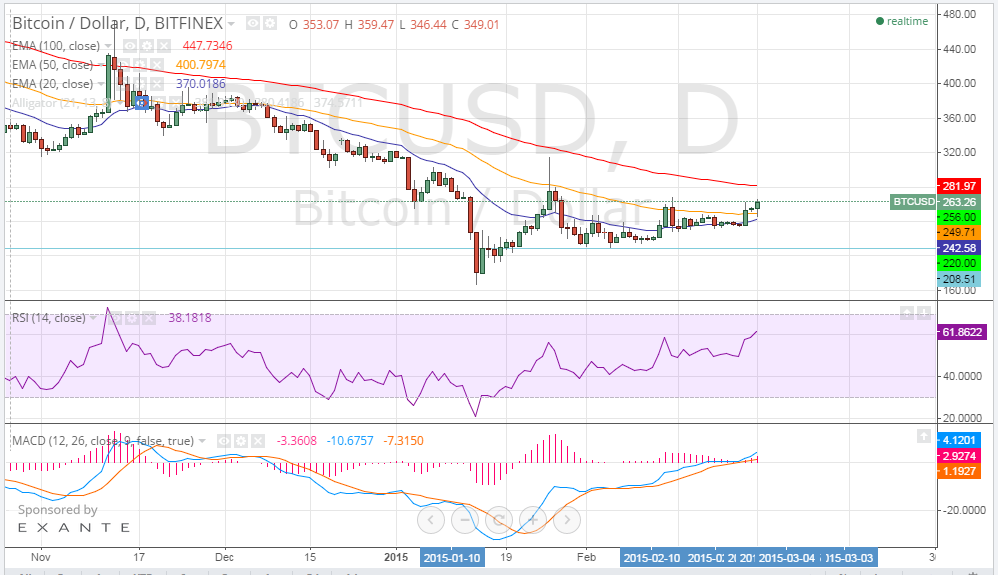
Let's now take a look at the 1 day Bitfinex BTCUSD charts (look at the below chart). We will plot the 100, 50 and 20 EMAs, the RSI and MACD indicator. The price now is above the 20 and 50 day EMAs, which means that the bearish trend that controlled the market during the past few months is already over.
The price has been below the 20, 50 and 100 period EMAs during most times since last November. If bitcoin price continues to be above the 20 day and 50 day EMAs, it is likely to rise up to test the US$300 resistance level during the next 7-10 days.
The RSI value has been ranging between 50 and 60 throughout last week and if we look closely, we can notice that the RSI curve started sloping in an upwards direction right before the bullish wave started. The RSI value indicates that we can still see bitcoin price rise to even higher levels; however, an RSI value above 70 would mean that bitcoin price is overbought and should be a signal proceeding a reversal of the new bullish trend.
The MACD indicator has a good sensitivity when predicting bullish rallies on the BTCUSD 1 day charts. As we can note on the below chart, the blue MACD indicator line has crossed above the red signal line just before the bullish wave pushed bitcoin price to higher levels. Moreover, the MACD value entered positive territory before the bullish rally ensued.
The current shape and value of the MACD indicator is in favor of the bullish trend’s continuation, so we can see the US$300 resistance level tested soon.

Conclusion
Bitcoin price attempted to reverse the bearish trend that ruled over the market during the past few months. As the US$256 resistance level has already been broken, the price is rising to attempt testing the next resistance level.
Our technical analysis predicts continuation of the new bullish wave during next week, especially since the price resumed rising after a 50% price correction wave pulled the price down to around US$247. Entering a long trade at US$260 can be set to take potential profit at around US$279 or even higher with a stop loss level at around US$256.
Did you enjoy this article? You may also be interested in reading these ones:
- Bitcoin Price Analysis: Week of Feb 23 (No Volatility)
- Bitcoin Price Analysis: Week of Feb 16 (Exchange Scare)
- Bitcoin Price Analysis: Week of Feb 9 (Tough Decisions)
