Note from the Author: Follow me (@Tone_LLT) for more timely updates throughout the week on price developments, latest charts and overall Bitcoin news commentary.
Last Week’s Review
Last Week we concluded with the following:
Last week we turned short term bullish, but thanks to the move being this strong, we are now turning bullish across all time frames. However, we acknowledge the fact that nothing moves up or down forever and are keeping an eye on a pull back to US$250 or perhaps even a bit lower. Because of the highflying action, it is not advisable to short this move even if prices do what we expect. As hard as it is to say, for those that missed this move up, chasing higher now is not a wise decision and neither is trying to guess the top of this news driven rally looking to profit from a counter trend pull back. The US$260-$290 zone should be treated with care.
Two scenarios in order of higher probabilities
Bearish: We over shot the 50-day SMA and at the moment sitting right at it at $US283, look for a pull back to $250 or even as low as $200 followed by a strong rally to new highs probably on the heals of some more good news or the breakup of the Eurozone.
Bullish: Bitcoin has a way of making fools out of experts and now that many have given up on the currency aspect of this technology, it is a perfect time to trick everyone again. There is open air to US$340 and it can get there in the blink of an eye just like the two day crash two weeks ago. Above US$340 we are looking to hit the 200-day SMA currently at US$385.
In light of the fact that we turned bullish across all time frames, the point was very clear that the price of bitcoins was way too high and we were expecting a drop to somewhere between US$200 & US$250. At the time this might have sounded crazy as the price shot up even higher hitting US$315 soon after the article came out but now a week later, the price is pushing the bottom of the pull back zone.
If it continues much lower, the bullish case for the rest of the year might need to be abandoned once again, but for now everything s playing out by the book. Also notice the comment about the “breakup of the Eurozone,” which will be expanded upon in a bit. In a nutshell, the Communist takeover of Greece is a great positive for the future of bitcoin’s price; wish I could say the same for the Greek people.
As usual, we will look at the weekly chart for a long-term picture:
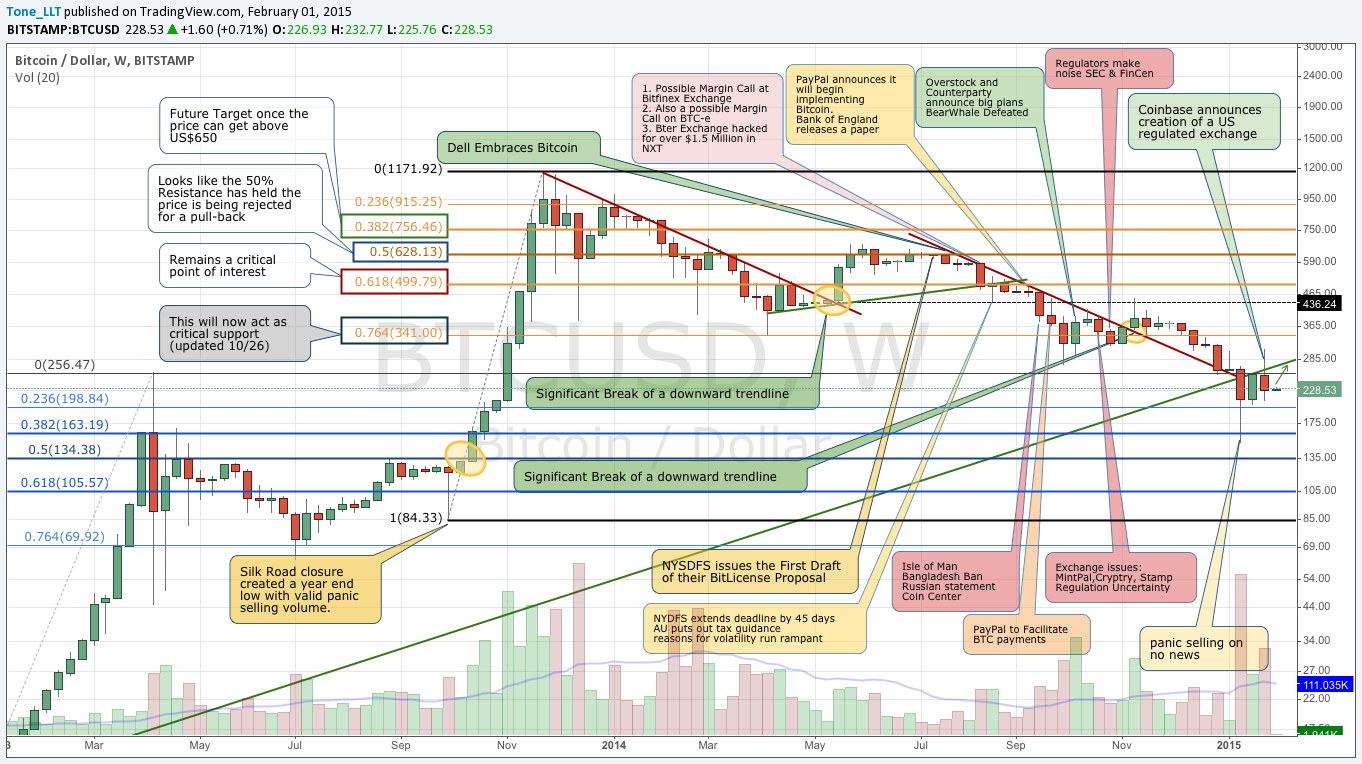
Just before last week’s publication the price was breaking the green trend-line to the upside and it looked like there was nothing stopping it. The expectation was for a pull-back back to the trend at around US$250, but now that we are clearly sitting under it, the long term view is becoming more concerning. The bounce from the US$166 low is strong and as long as we can hold US$200 we can ride this trend line in an upward direction until some real good news is ready to take Bitcion back to recent highs.
Fundamentals & News
As usual we present 3 good roundups for those too busy to keep up with it all:
Cointelegraph Weekly Roundup by Armand Tanzarian
Bitcoin News Roundup by Bitsmith on TheCoinsman
Weekly News Roundup by Brave New Coin
The major news events this week are identical to what was mentioned last week. Coinbase is still in the news with the revelation that they are not actually licensed for NY or CA and it’s nice to see more articles pointing out why the true Bitcoin believers have been advising their friends to stay as far away from Coinbase as possible.
The problem that Coinbase faces is simple: they are looking to comply with all aspects of US financial law and just like 90% of startups in the bitcoin space, they are ignoring the political and anti-establishment nature of Bitcoin itself. No mater how you slice it, this experiment of playing with the US financial services is going to end badly either for any company that attempts to operate in the US while trying to get around the laws or the laws will come down hard on any individual that uses a fully US regulated exchange.
The only logical explanation here is that Coinbase is going after institutional trading companies who have the ability to influence laws and claim bitcoin to the Tax authorities in ways that benefit them. As for those trading from home, there is a reason why a broker makes you sign 20-30 documents, just keep that in mind.
Speaking of laws, the Silk Road trial is really picking up. Here are a few good recent articles:
Dread Pirate Roberts: Imprisonment vs. Innovation by Juan S. Galt
‘Dirty’ Bitcoins, Murder-for-Hire Plots Surface in Silk Road Trial by Aaron van Wirdum
And here is a video review from Julia Tourianski that is a must watch.
It’s a simple fact that a free market requires a free market medium of exchange. What a lot of people don’t realize is that if you have a website that creates a free market, it’s those selling and buying items the Governments deem illegal will become traded first, but given enough time, all items will soon move to the free market and perhaps that is what scares Governments the most.
These markets will continue to evolve and Bitcoin will always have a place to be spent. And here is the best news, when bitcoins are spent in the free (or black) market, the majority remains in bitcoin and hence creates velocity raising the price. The current tax code and other regulations make this proposition difficult for most businesses and hence, we end up in this situation where most merchants immediately liquidate for fiat.
As a final note, the situation in Europe is really something to keep an eye on. The newly elected Far-Left Greek party leadership is unpredictable as to the direction the country will take. At the moment no one knows if they intend to leave the Euro for their own currency and/or default on all the debts (which should have been done back in 2010 when those debts were a fraction of what it is today).
In the mean time, expect the Greek economy to slow down further as anyone with wealth will now begin to hide it because they see the Cyprus situation coming back with a vengeance. The continual breakup of the Eurozone is a big positive for Bitcoin but only in the surrounding countries. Once a country goes into turmoil, finding a way to feed the family become more important than wealth preservation, so towards the end of 2015 expect the price a Bitcoin to gain a significant push from those evil capitalists looking to move their ‘legally’ earned money from the radical left and right leaders that are picking up electoral votes all over the region.
Education (Trend Change Part II)
This is a very important topic and in light of this weeks action it should really be covered one more time so that some of the beginner readers can better understand what is happening. Here are the 3 steps needed to identify a trend change and last week’s picture is provided once again.
- A break of a trend line
- A move in the direction of the original trend creating a higher low (or a lower high)
- A big move in the direction of the new trend creating a higher high (or lower low)
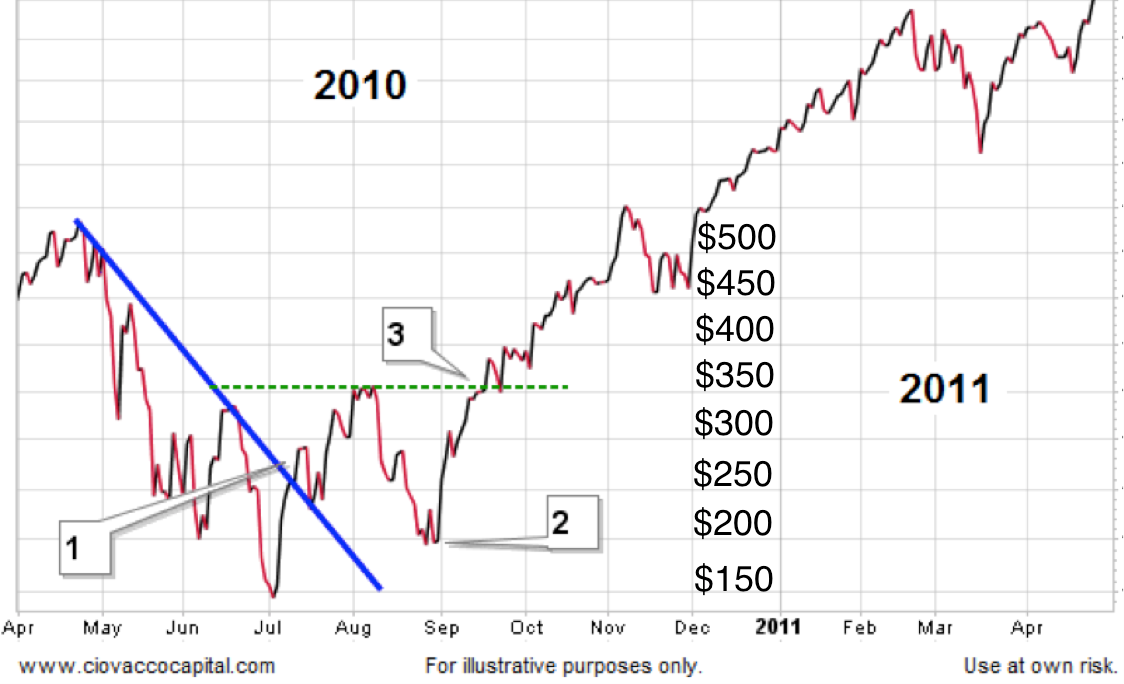
The chart above is still the same with the only difference being the hypothetical Dollar values giving the chart a vertical scale that is in the vicinity of the price of Bitcoin. Of course the original picture has nothing to do with bitcoin and is in fact a graph of the S&P500 Stock index, but is shows the point of how tricky some of these trend changes might actually be. In the chart above, it is clear that it took a drop of 75% of the up move from the $150 low to the $350 high, so Step 2 did not arrive until the price bounced at US$200.
Of course, this does not mean that Bitcoin is guaranteed for an immediate rebound, but it does mean that this fall from US$315 to a low of US$211 is certainly within the limits of this technical phenomenon. Perhaps it is a bit too early to expect prices to rise the rest of the year, but what we are doing is very carefully waiting for point 2 to make itself clear, though in reality it can only do that once we start approaching point 3. Bitcoin has a lot of support at every US$10 increment from US$190 to US$250. There is still a high probability that the low for the year is in, so don’t give up on the bullish case just yet.
Daily Overview
Here is the usual one-year look back using daily candles:
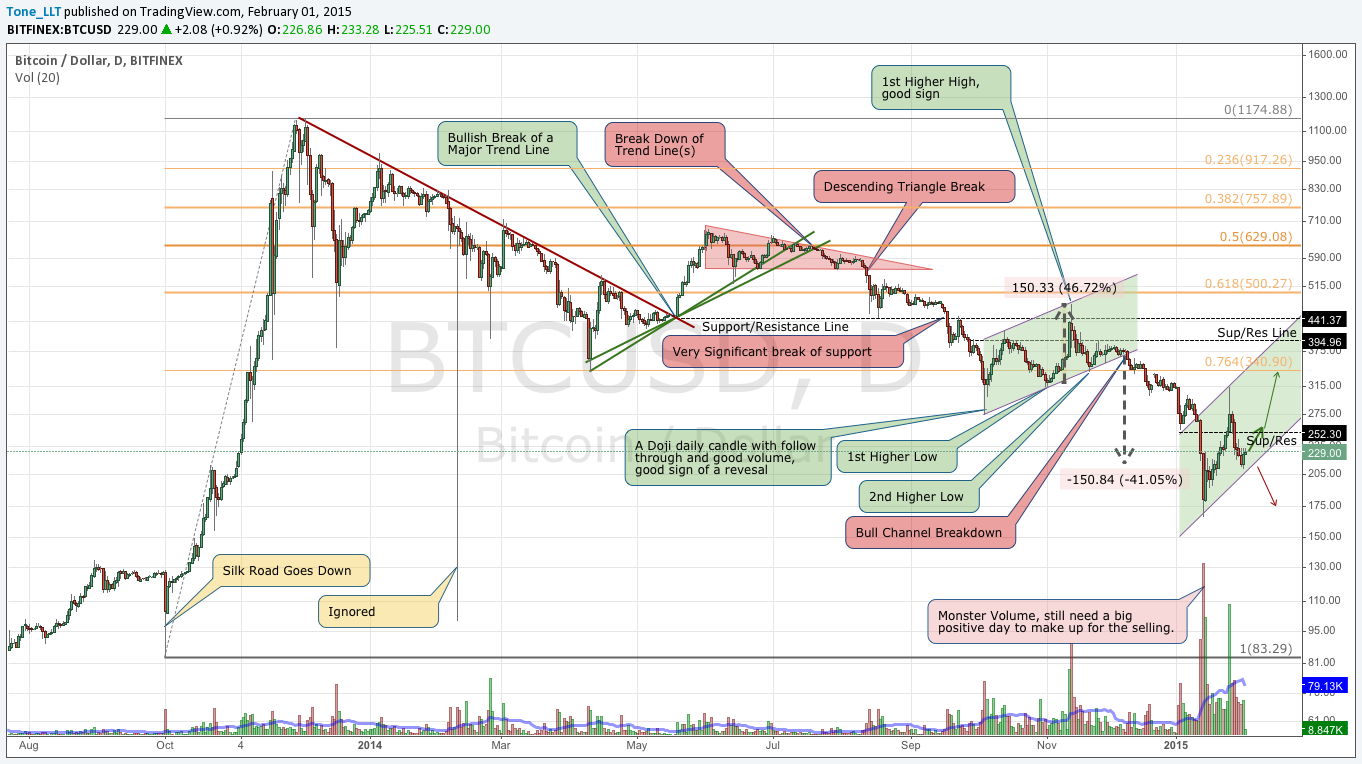
The Long-Term Daily chart looks like there is a chance the price is ready to turn up any moment and US$210 seems like the optimal place for it to do so. After a drop of over US$100, it is more than reasonable to look for a bounce here even if it is just temporary. Nothing goes straight down just like nothing will go straight up. A good trader however admits a mistake and cuts losses early.
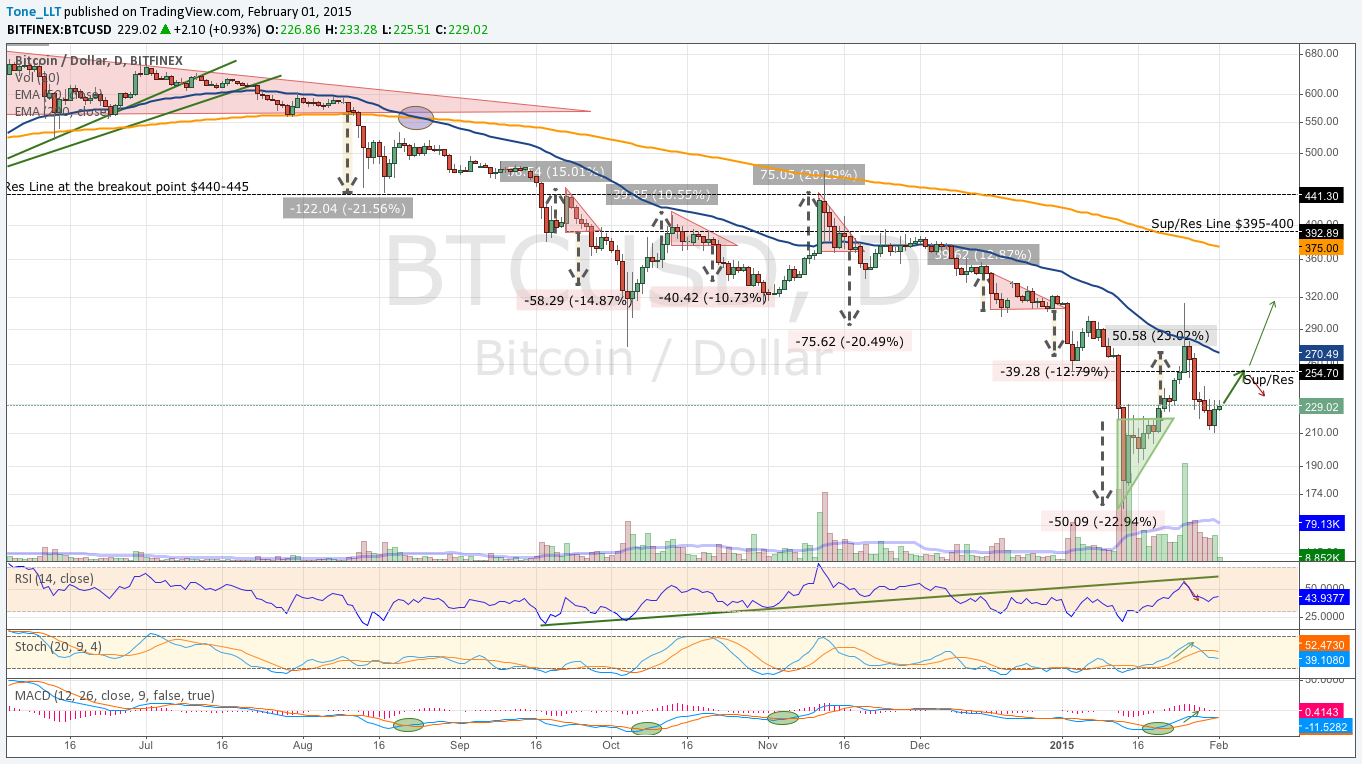
There is not much difference in the zoomed in view of the same chart. We have fallen as fast as we went up and at the moment it looks like momentum is slowing down as the price is showing the first signs of stabilization. This is good. Let’s see if there are some more legs here to at least US$250 and then try to re-evaluate what the future holds. Also notice how the ‘arrows’ in the indicators have been untouched since last week and if you look carefully, there is a red arrow in the RSI, which was by pure luck identical to the movement of the indicator.
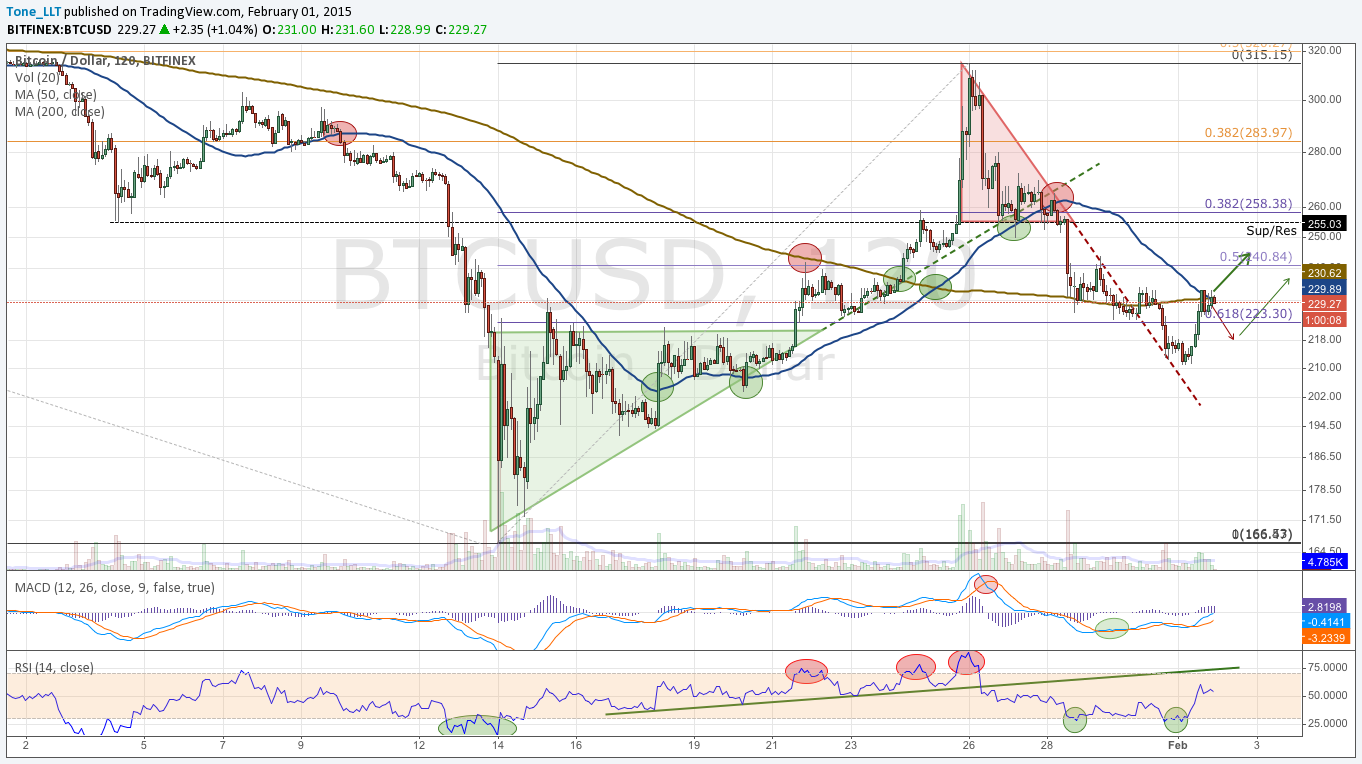
As an additional chart this week in light of the highflying action recently, here is the one that has been highlighted on Twitter (@Tone_LLT) but might not be as useful in these weekly updates. It represents 2-hr candles and is demonstrating that we have bounced right into a bearish moving average cross and the road back to US$300 might not be such an easy one. By the time the article comes out, this situation would resolve itself, and since we have already hung around just above US$230 for half a day, the more likely move is up to US$245-250.
Conclusion
We remain bullish across all time frames though the long-term view is not as strong as last week. We are keeping an eye on the US$210-220 zone to be our turn to represent step #2 of a trend change but it is very premature to make the call and requires weeks of confirmation. However, it is reasonable to begin establishing bullish positions because the risk-reward ratio is really good, picking up bitcoins in the US$220-235 zone for a short-term move back to US$250 or a longer-term goal above US$300. The risk is very small as a move down to the low teens would imply the breakout is on hold and lower prices are very likely
Two scenarios in order of higher probabilities
Bullish: We are expecting a breakout to surpass the most recent high of US$243 and hopefully break above US$250 resistance. From there it is very likely that a pause would be needed but we are eyeing a daily closure above the 50-day SMA for the first time since November some time this month.
Bearish: The bear rears its ugly head once the recent lows are taken out. Only if the price drops under US$210 will we consider the possibility of lower prices. At this point there is really not much support so if we go under $US200, going down to as low as US$100 becomes a real possibility.
Reference Point: Sunday Feb 1 11:30 pm ET, Bitfinex Price US$230
About the author
Tone Vays is a 10 year veteran of Wall Street working for the likes of JP Morgan Chase and Bear Sterns within their Asset Management divisions. Trading experience includes Equities, Options, Futures and more recently Cryptocurrencies. He is a Bitcoin believer who frequently helps run the live exchange (Satoshi Square) at the NYC Bitcoin Center and more recently started speaking at Bitcoin Conferences world wide. He also runs his own personal blog called LibertyLifeTrail.
Disclaimer: Articles regarding the potential movement in cryptocurrency prices are not to be treated as trading advice. Neither Cointelegraph nor the Author assumes responsibility for any trade losses as the final decision on trade execution lies with the reader. Always remember that only those in possession of the private keys are in control of the money.
Did you enjoy this article? You may also be interested in reading these ones:
