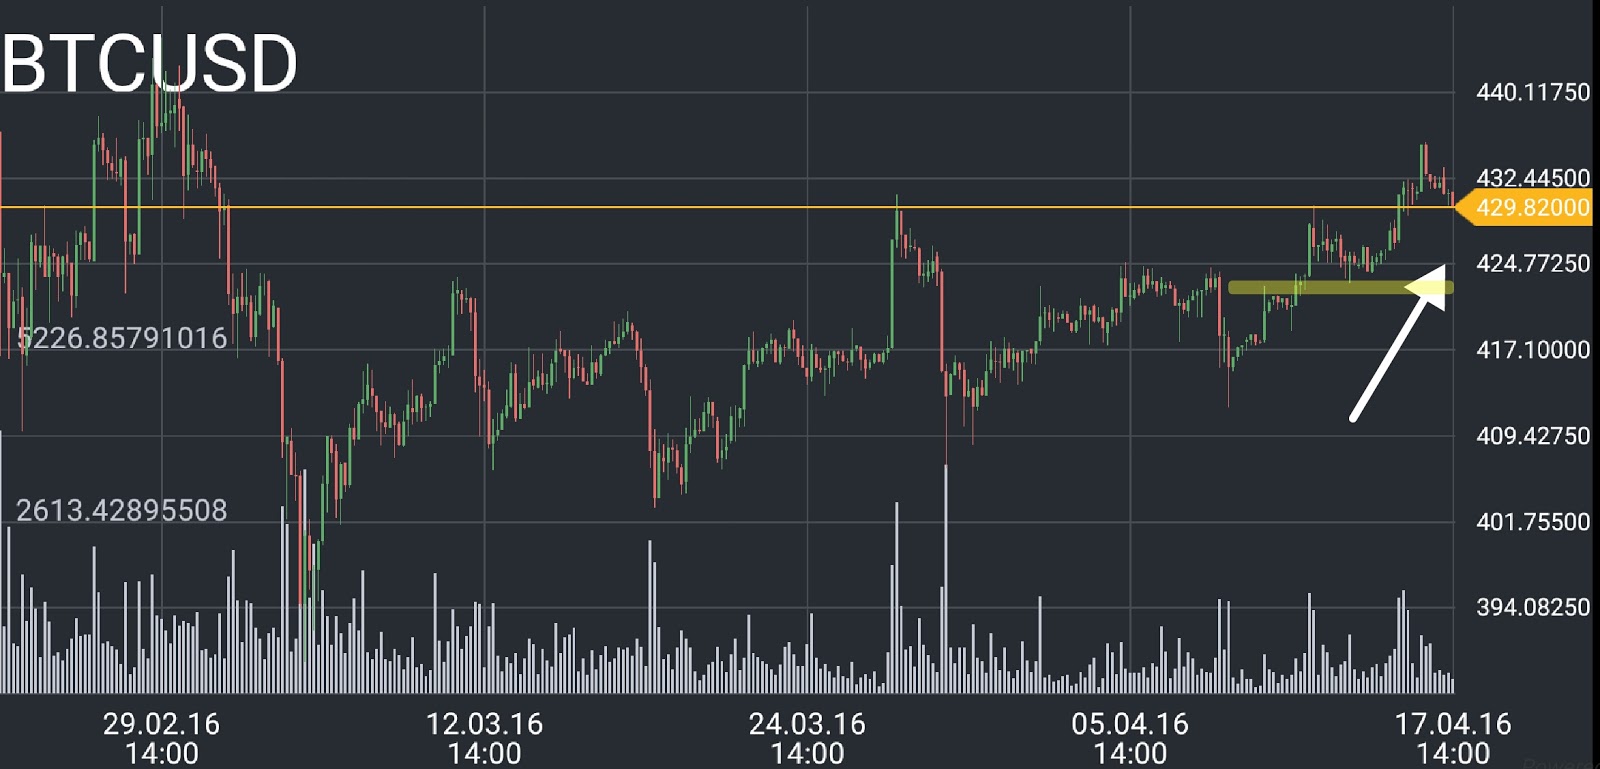
Bitcoin is currently in a medium-term upward trend. After a continuous flat, the bulls have finally won the advantage. Will that movement become a part of a long-term upward trend?
When should we expect a turn to decline?
Without forming a turn to decline, Bitcoin’s price has headed towards the upper resistance, where it has fortified and turned to growth.

The next significant upper level is $445, that is if the trend’s structure stays intact.
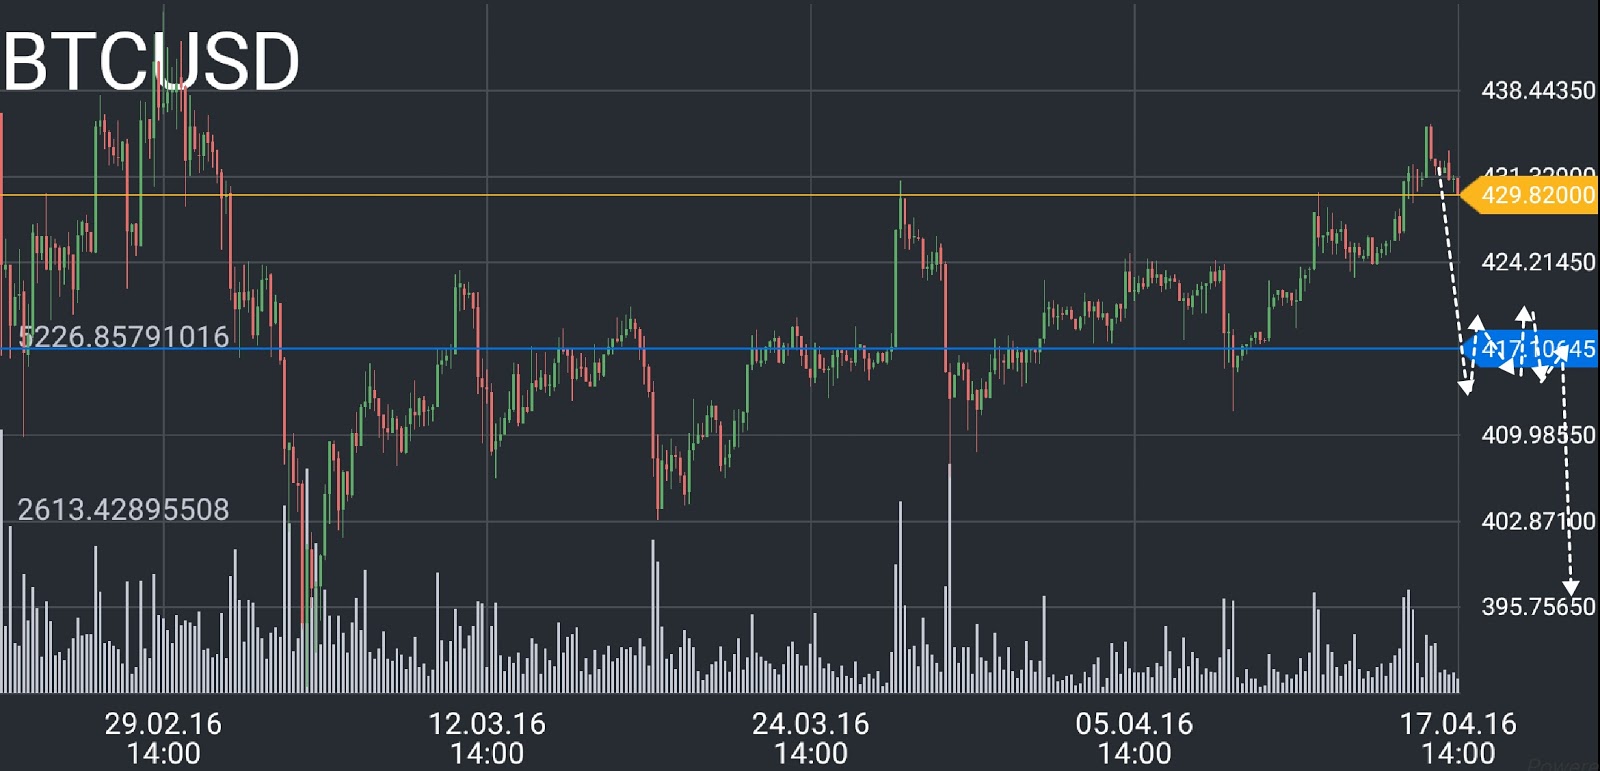
The maximum level for a rebound towards the whole upward trend will be at $417. Large trading volumes has accumulated at that level. If the bulls don’t hold it, a sharp drop is likely to follow. It’s probable that that drop will start at $424.2, however the $417 resistance is more significant.
Thus, if the bulls hold the advantage in the short-term scope, there will be a rebound at the $424 mark and a continuation of the upward trend; otherwise, there will be a start of at least a downward correction.

Critical points for the upward trend are the levels of $424.2 and $417. A turn to decline is the most probable at those lines.
