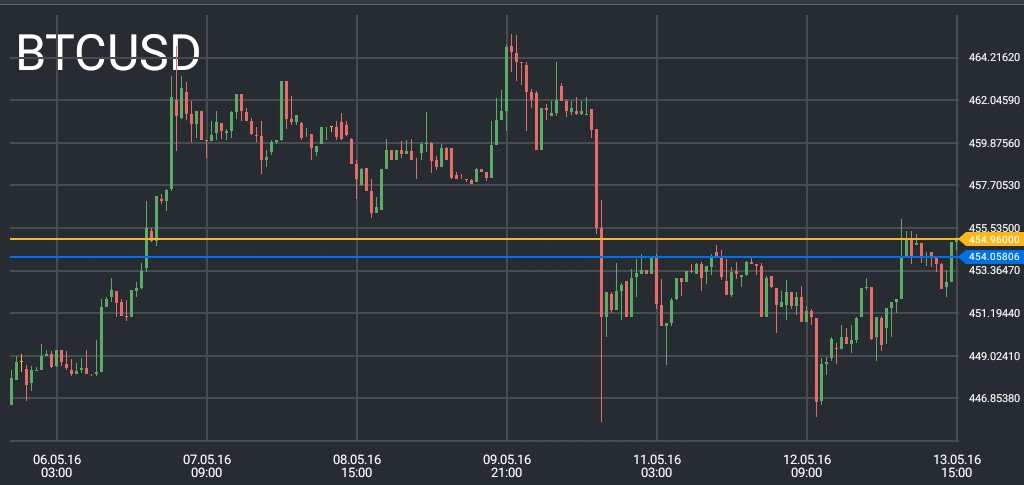
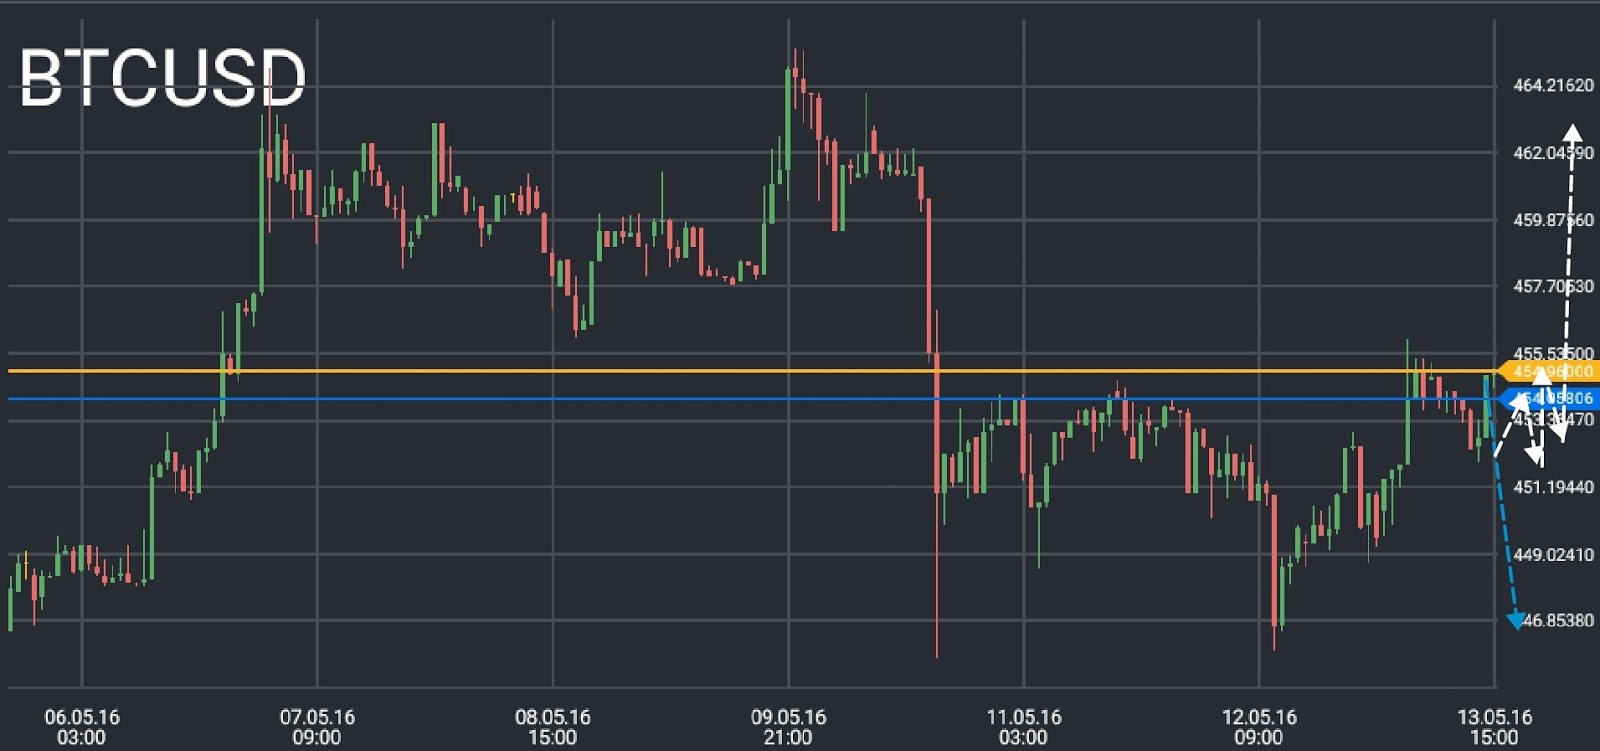
Bitcoin has finished its downward rebound wave. The price has stopped at a key level, where the market is going to choose a direction.
Will the downward movement continue?
A key resistance line of $454 is responsible for the structure of the downward trend. Bitcoin’s price has stopped at that level, as it’s dominated by active bears. That’s why the structure of the downward trend can be disrupted at that mark.

The advantage of the bulls will be able to be seen by the structure of the price. If the bears are a majority, the price will be less likely to form a wave of turn to growth at the level of $454. But if the advantage is with the bulls, a turn to growth will form. In that case, there will be a chance to update the peak of the medium-term upward trend.

At the level of $454, Bitcoin’s price may form a turn to growth.
