Analytics provided by BBA
We are now in the slowest trading period of the year for both the legacy and cryptocurrency markets, which means volatility and volume should remain light until after the Labor Day weekend in the US.
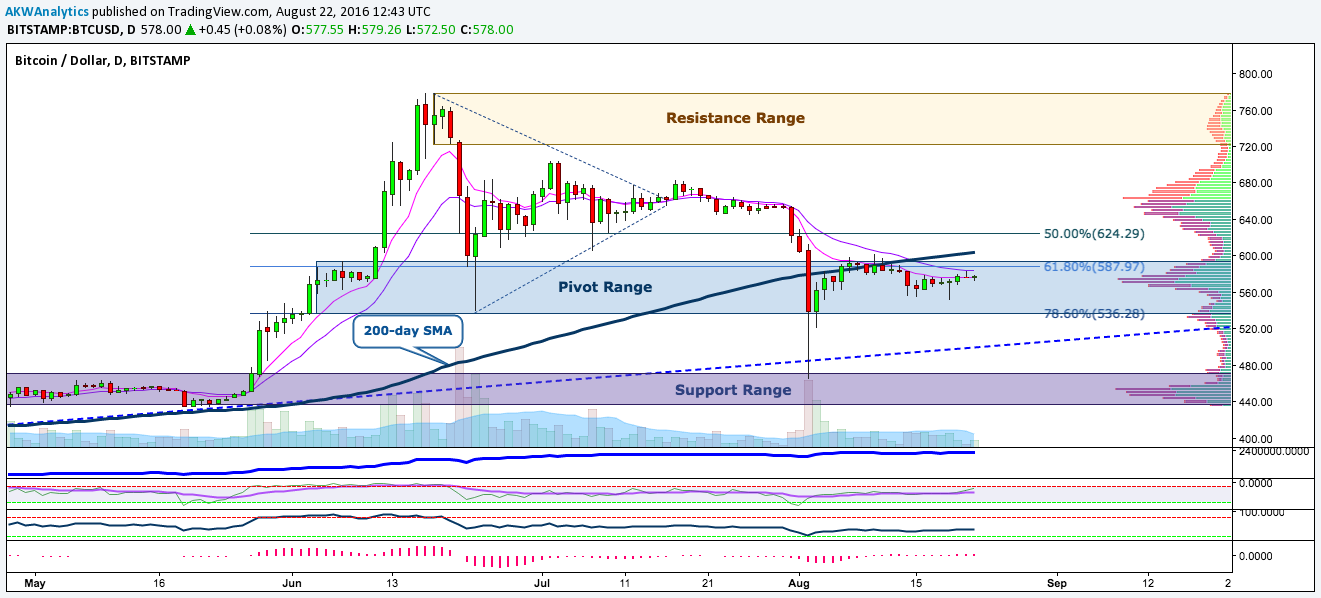
Bitcoin has once again flatlined around the $570 level as the summer doldrums roll on. Traditionally the late August timeframe is the slowest time of the year for the financial markets considering it is the most popular time of year for pre-“back to school” vacationing. Up until recently this phenomenon has avoided the small crypto markets due to a lack of traditional players, although over the past few years bitcoin has followed suit in terms of late summer stagnation. While we want to remain neutral and patient on the market over the near term, we are fairly certain that a breakout move will materialize over the next 2 – 3 weeks, at least out of the $550 – 600 trading range that we have been consolidating in since just after the Finex hack.
Given we looked at the longer term 3-day chart last week, this week we focus a bit more in an attempt to glean technical clues on the shorter term timeframe. We can see that there are still many mixed signals for the time being, a sign that the sideways action could persist for several more days. Price is still firmly within the blue pivot area, which is also delineating the current trading range, and is sitting between the 61.8% and 78.6% Fibonacci retracement levels (also known as the OTE zone). Also notice that the market is trying to put in an Adam & Eve bottom around $550 while the near term EMA’s trying to flatten out in preparation for a reversal. Additionally, the A/D line continues to slowly push to the upside despite large volume profile notches both above and below the market.
On the other hand, it’s not all coming up roses for the bulls just yet. Moving on to momentum we can see that Willy is slowly plodding higher despite little progress to the upside in terms of price, RSI still cannot break above the centerline, MACD looks weak as it struggles with zero, and the 200 SMA continues to slow its ascent given price is now below it by about $30. Finally, the previously mentioned volume profile notches, particularly below the market price, could use some more filling in prior to resolving out of this range which is why we think the medium term uptrend line down around $520 is a good target for a one last washout prior to a move back above $600.

Considering unfavorable seasonality and lack of fundamental catalysts on the near term horizon, we think this week could be rather boring much like we have seen over the past few weeks. Patience remains our most valuable tool in this environment which implies that capital preservation and strategic cash deployment are what will give us our edge right now. Until the market moves out of this range contraction and consolidation into a trending market, we will stay neutral with a longer term bullish bias.
BullBear Analytics 20% Discount
BullBear Analytics is the longest standing cryptocurrency forecasters in the market. They started in 2010, doing technical reports in bitcointalk.org, and have evolved into a buzzing community of traders. Adam is BBA’s chief analyst. We are offering a special discount to our CT followers, enter ‘SUMMER1’ at checkout for a 20% discount on all packages! (If you’re interested in paying in BTC, contact us here). Cheers!
Disclaimer: Please always do your own due diligence, and consult your financial advisor. Author owns and trades bitcoins and other financial markets mentioned in this communication. We never provide actual trading recommendations. Trading remains at your own risk. Never invest unless you can afford to lose your entire investment. Please read our full terms of service and disclaimer at the BullBear Analytics Disclaimers & Policies page.
