The views and opinions expressed here are solely those of authors/contributors and do not necessarily reflect the views of Cointelegraph.com. Every investment and trading move involves risk, you should conduct your own research when making a decision.
The market data is provided by the HitBTC exchange.
After the discussions at the World Economic Forum in Davos, the world leaders are getting ready to deliberate on cryptocurrencies in the forthcoming G20 summit in March. Many leaders seek to regulate cryptocurrencies, but if we study the consequences of the Chinese regulations, we find that they have been ineffective.
Traders based in China have started trading at cryptocurrency exchanges in Hong Kong. The Chinese government has only increased the risk for their traders because now they are forced to buy Bitcoin at a premium of about $1,200 compared to other exchanges.
The leaders and central banks, instead of blindly opposing cryptocurrencies should chalk out a strategy to embrace them after discussing with the crypto stalwarts.
BTC/USD
The Bitcoin bulls have been defending the $10,000 mark for the past few days. But they have not been able to push prices higher, which is a point of concern.
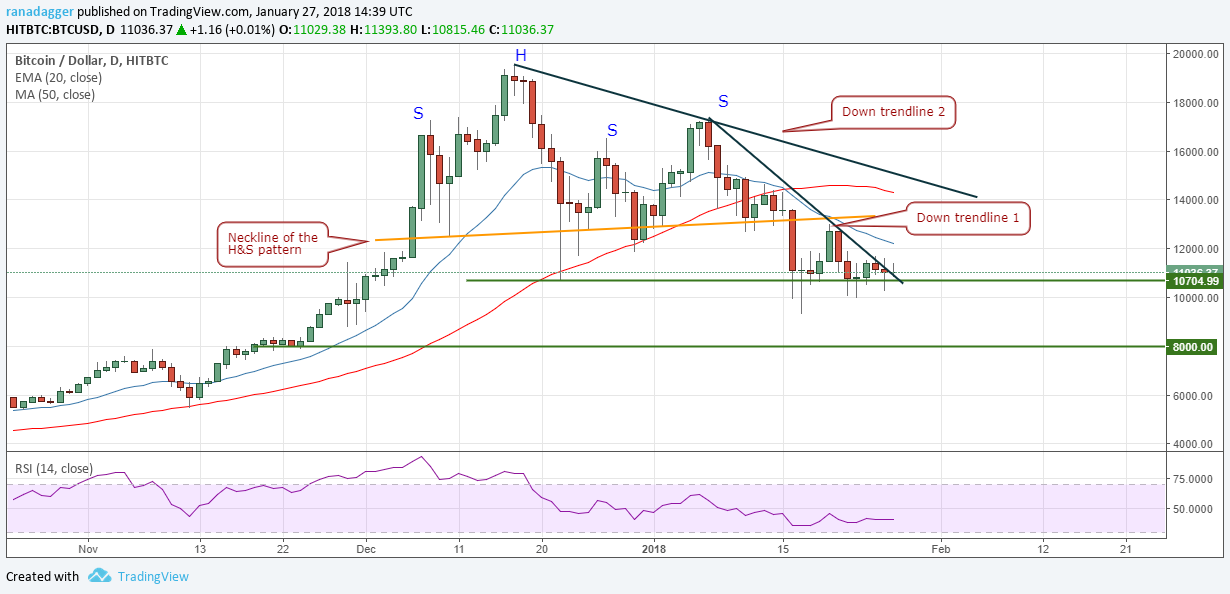
The cryptocurrency has broken out of the down trendline one, which shows that the momentum on the downside has decreased. We can expect a few more days of range bound action between $10,000 and $12,000.
It is difficult to predict whether the upside or the downside move comes next.
If the bulls succeed in breaking out of the 20-day EMA, which is currently at $12,218, the BTC/USD pair should rally to the down trendline two. The traders can wait for the breakout above $12,200 to sustain for about 4-hours and then buy with a stop-loss at $9,900. The target objective is a move to $14,500.
On the downside, if the bears break below $9,900, the selling is likely to intensify. The next stop on the downside is $8,000.
As we are uncertain about the next move, we have elucidated both possibilities. We don’t find any setups as long as the price remains within the range.
ETH/USD
In our previous analysis, we had recommended long positions in Ethereum on dips to $1,000. Our long positions were triggered yesterday, Jan. 27.
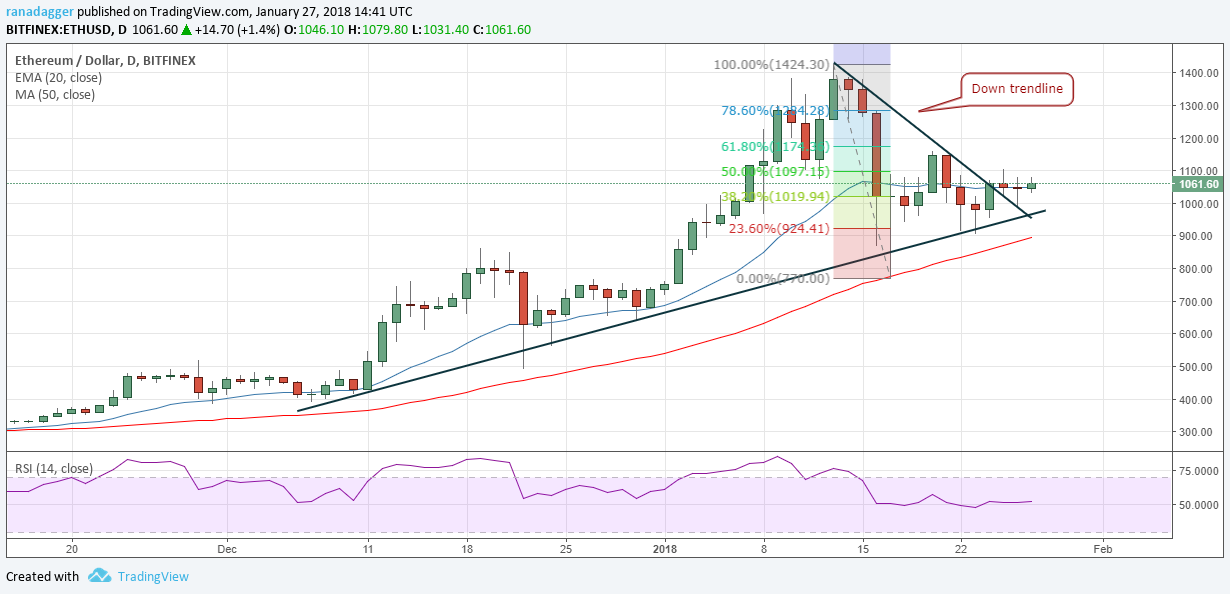
After touching an intraday high of $1,102.4 on Jan. 25, the cryptocurrency fell to the down trendline yesterday, Jan. 26. Now, if it manages to break out of $1,110, we can expect it to rally to $1,174.36 levels.
Once the ETH/USD pair breaks out of $1,110, traders should raise the stop loss from the current levels of $840 to $950. That will decrease our risk. Partial profits can be booked at $1,170 levels, and the stops on the remaining positions should be trailed higher.
BCH/USD
Bitcoin Cash has a history of entering into small range trading days, before a significant breakout or a breakdown. We had seen a similar pattern in August and October last year, 2017.
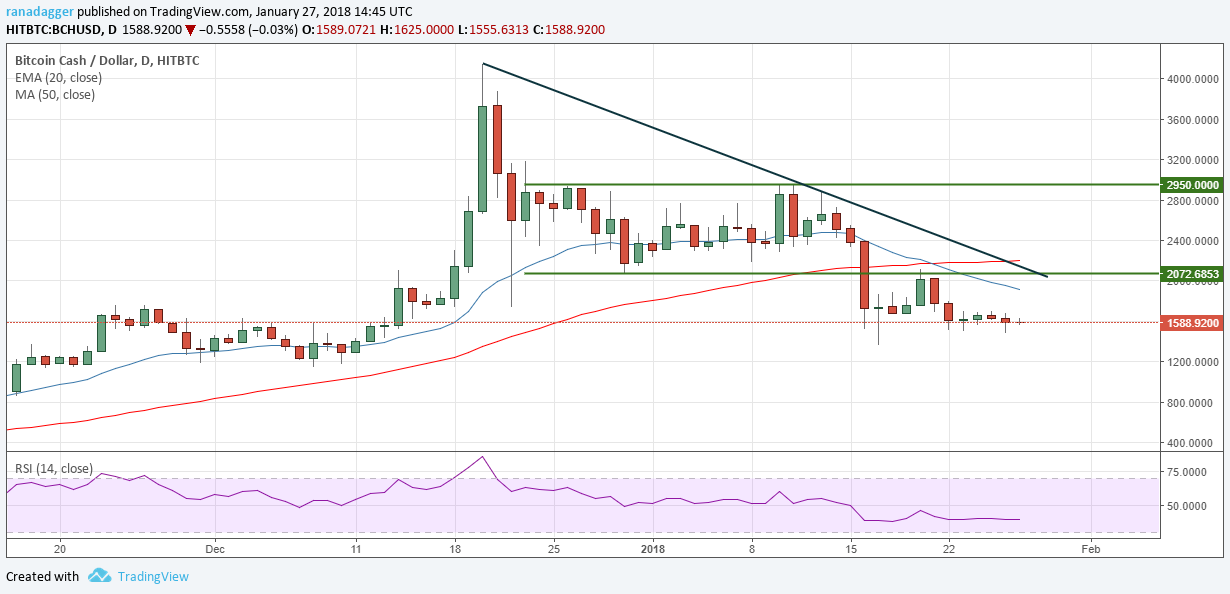
Currently, the price has been stuck in a tight range of $1,479 on the downside and $1,700 on the upside.
Any breakout of this range is likely to face a slew of resistance at the 20-day EMA, the downtrend line and $2,072.6853.
On the downside, support is at the January 17th low of $1364.9657 and $1141.
We don’t find any tradable setup on the BCH/USD pair.
XRP/USD
Ripple continues to trade inside the range of $0.87 and $1.74 with a downward bias. If the cryptocurrency breaks down of $1.09 levels, a fall to the lower end of the range is likely.
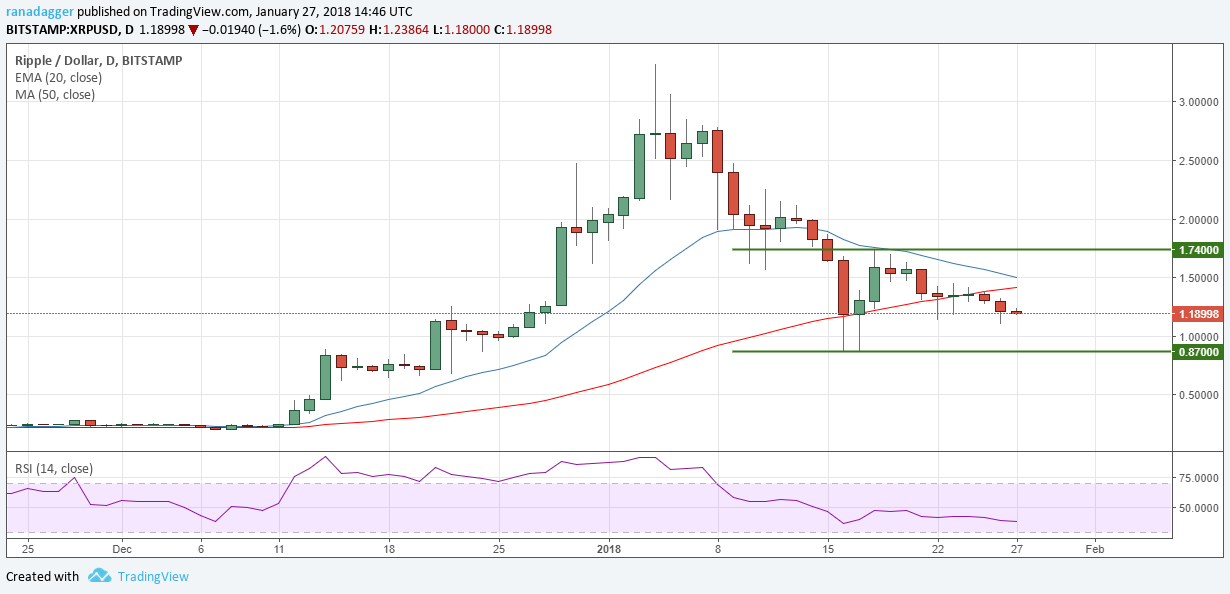
The XRP/USD pair is struggling to find any buyers. Therefore, we should wait for the cryptocurrency to bounce off the $0.87 lows before initiating any long positions.
The probable bearish crossover of the 20-day EMA and the 50-day SMA is another negative sign. We anticipate the range-bound trading action to continue for the next few days.
XLM/USD
Stellar is comparatively stronger cryptocurrency because it is quoting above both the 20-day EMA and the 50-day SMA and both are trending higher, whereas, most other top currencies are witnessing a bearish crossover of the moving averages.
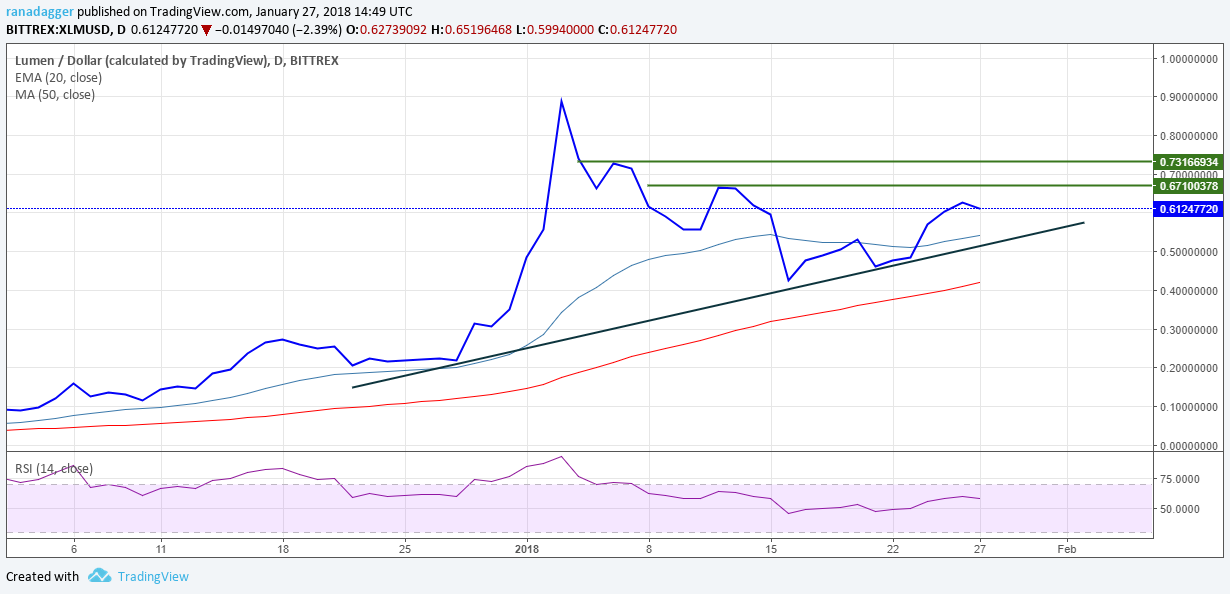
If the overall sentiment remains subdued, we believe that the XLM/USD pair will face resistance at the $0.671 mark. Currently, we don’t have a suitable stop loss, so, we’d better wait for a correction to the trendline before initiating any long positions.
Once the cryptocurrency breaks out of the $0.671 mark, a move towards the highs is likely, with a small resistance at $0.732 levels.
It might be a good idea to wait for a low-risk trading opportunity to initiate fresh positions.
LTC/USD
Litecoin broke below the $175 support level yesterday, Jan. 26, but recovered and closed above it by the end of the day.
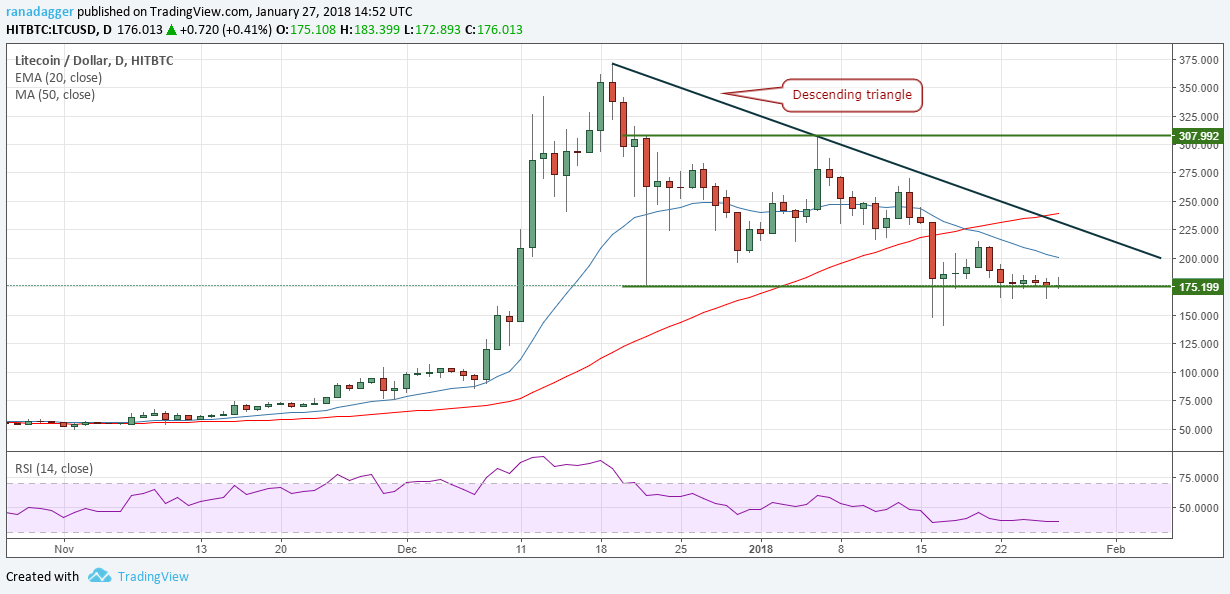
What might be worth considering is the fact that the bulls are not able to push prices higher. If we don’t get an upside massive range move within a couple of days, chances are that the bears will again attempt to sink the cryptocurrency.
On the downside, support exists at $140.001, which is the intraday low of Jan. 17. If this level also breaks, the LTC/USD pair can sink to the next support level of $85.
If the bulls manage to push prices higher, they will face resistance at $200 from the 20-day EMA and at the down trendline of the descending triangle.
We should change our bearish view only after price breaks out of $225.
XEM/USD
NEM broke below the $0.86 levels yesterday, Jan. 26, and made an intraday low of $0.775. However, the bears were not able to capitalize on the breakdown.
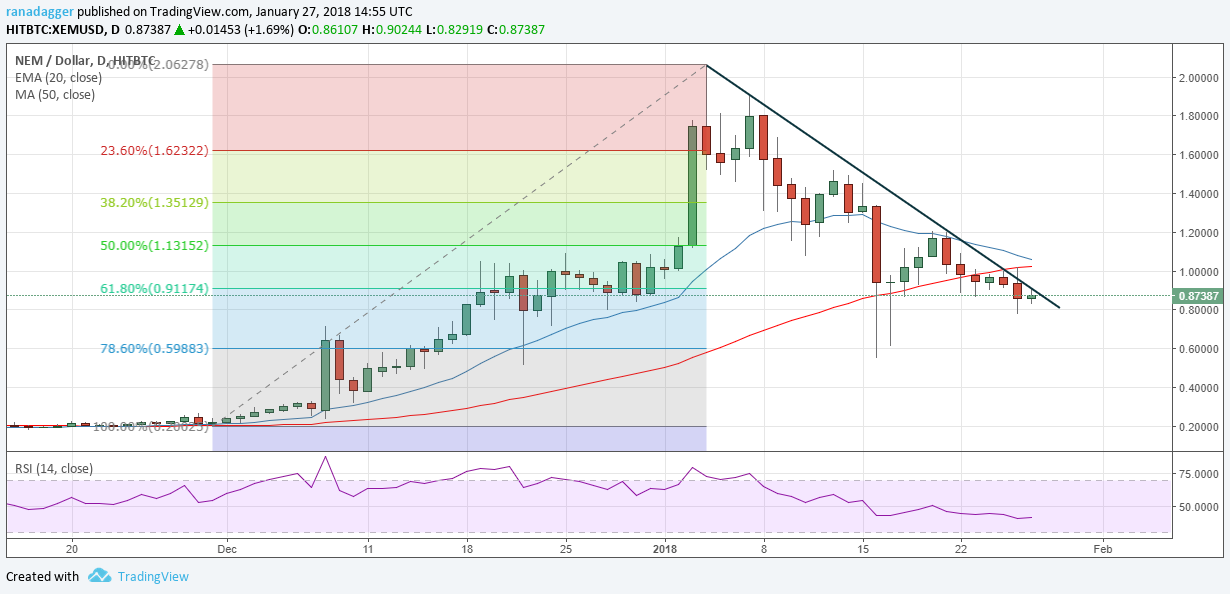
Today, we find some buying at the lower levels. The bulls are attempting to break out of the down trendline, which continues to be major resistance. Even if the price breaks out of this, we expect the XEM/USD pair to face resistance at the $1 levels from both the moving averages.
The cryptocurrency will become bullish once it breaks out of $1.21 levels. We shall wait for it to turn positive before recommending any long positions.
ADA/BTC
Cardano again failed to break out of 0.00006. That’s why the buy suggested in the previous analysis did not trigger.
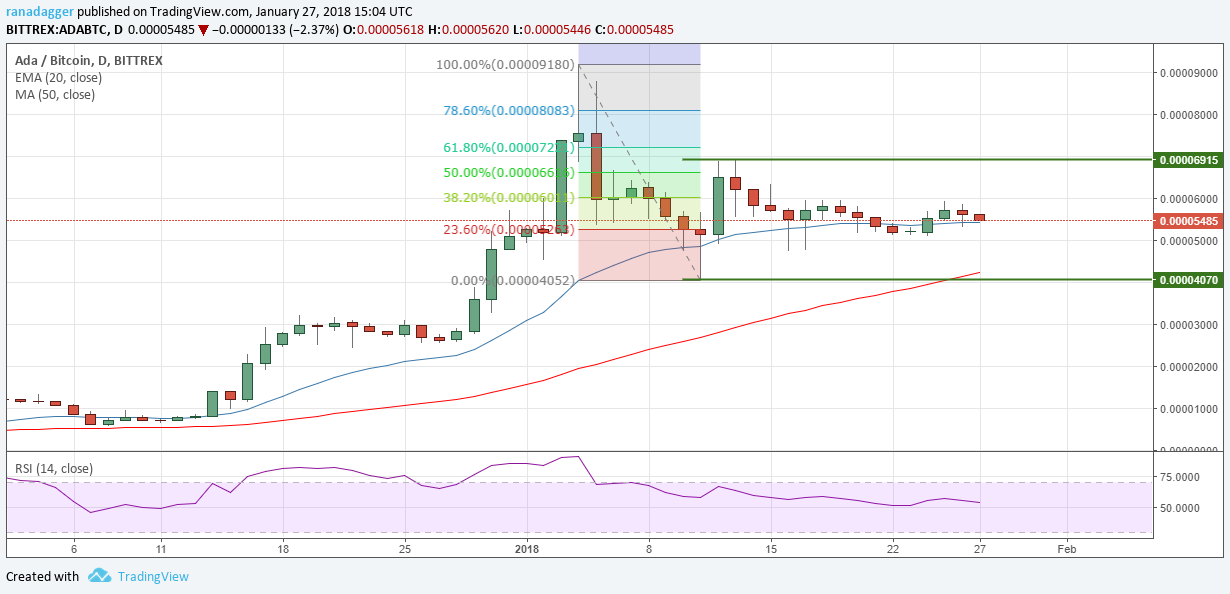
The ADA/BTC pair is now likely to fall to the 0.00005 levels, which should act as a support. However, if this level breaks, a fall to 0.00004730 and after that to 0.00004070 can’t be ruled out.
We shall wait for the cryptocurrency to turn bullish before recommending any fresh positions.
The charts for the analysis are provided by TradingView.
