The views and opinions expressed here are solely those of the author and do not necessarily reflect the views of Cointelegraph.com. Every investment and trading move involves risk, you should conduct your own research when making a decision.
The market data is provided by the HitBTC exchange.
Oki Matsumoto, CEO of Japanese online broker Monex Group, believes that the cryptocurrency markets will take off similar to the derivatives market. If his prediction proves to be correct, the digital currency markets can assume a significant proportion of the total global trading volume. This shows that there is a huge opportunity for the traders and investors who are early in the game.
The regulators, however, are confused on how to classify digital currencies. The Commodity Futures Trading Commission believes cryptocurrencies should be classified as commodities, whereas, the Securities and Exchange Commission wants to label them as securities. Whatever the outcome, after an initial hiccup, the cryptocurrency market will continue to grow because of its huge potential.
Even the South Korean Central Bank agrees that crypto and blockchain can realize the dream of a cashless society.
Bitcoin
Bitcoin broke below the ascending channel on May 01 but found support at the 20-day EMA. It did not hit our raised stop loss at $8,600.
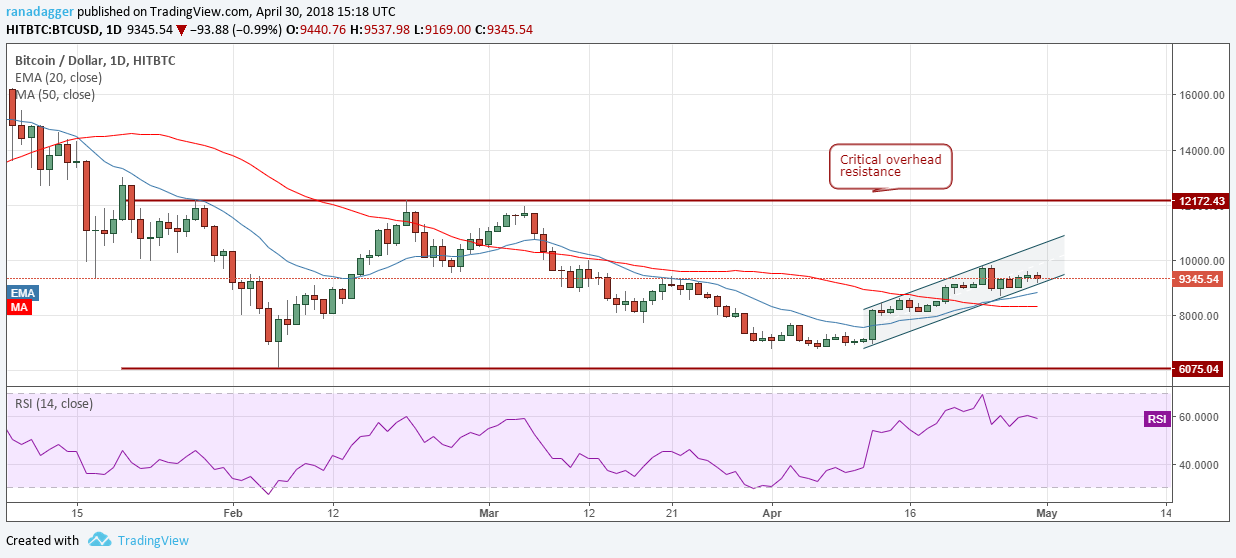
The bulls will again try to break into the ascending channel, which will be a bullish sign. We also find a small symmetrical triangle, a continuation pattern. On a breakout above $9,500, the BTC/USD pair can rally to the resistance line of the channel at $10,500.
If the 20-day EMA breaks down, a decline to the 50-day SMA will be on the cards. We shall raise the stop loss, once the digital currency sustains above $9,500.
Ethereum
Ethereum broke below the trendline on May 01, but the dip was aggressively purchased, due to which the prices recovered and closed (UTC) above the trendline.
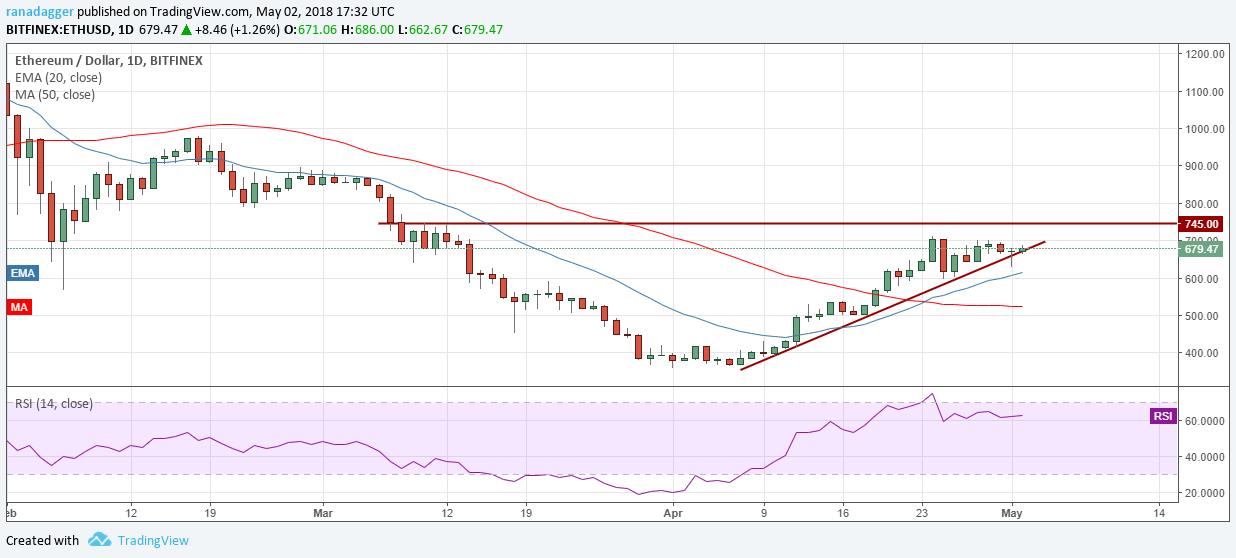
$700 is proving to be a major hurdle for the bulls. If the ETH/USD pair breaks out of this, it will move to $745 where it might again face a minor resistance.
The cryptocurrency will gain strength and rally to $900 and then to $1,000 once it closes above $745. On the downside, the 20-day SMA should act as a strong support. Below this level, the decline can extend to the 50-day EMA.
So we’d better wait for the breakout before proposing any trade.
Bitcoin Cash
Bitcoin Cash has been consolidating near the upper end of the range between $1,221 and $1,600. It will enter the next leg of the up move after breaking out of $1,600. The immediate target of this breakout is $2,000.
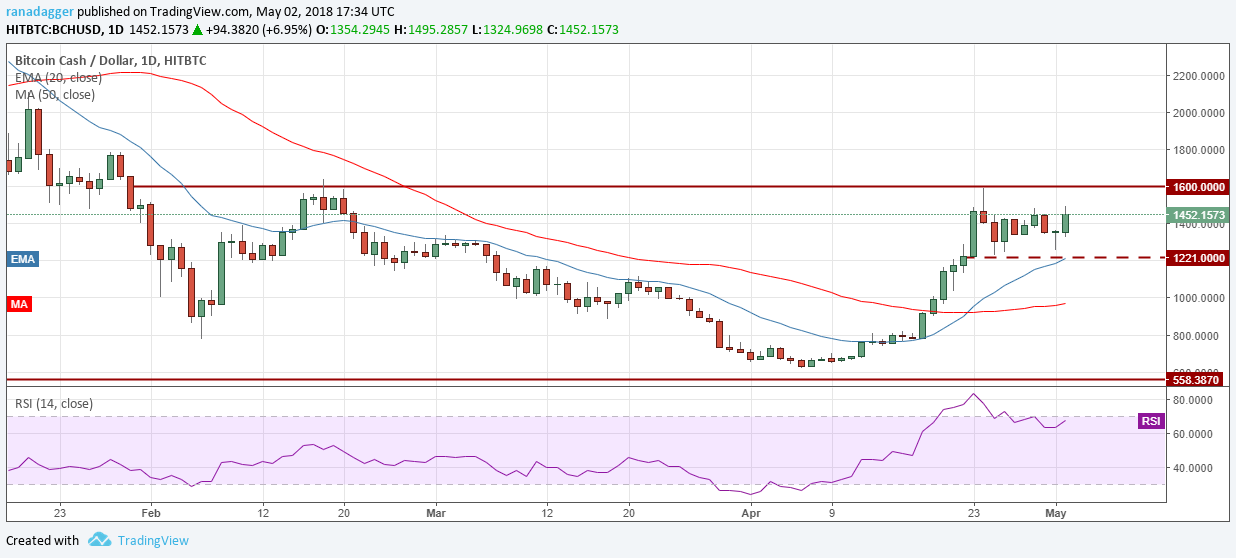
A breakdown below $1,221 will prove to be negative, and the BCH/USD pair can slide to below $1,000 levels.
We don’t have any suggestions on trades before the breakout.
Ripple
After failing to resume its uptrend on April 24, Ripple has become range-bound between $0.76 to $0.93777.
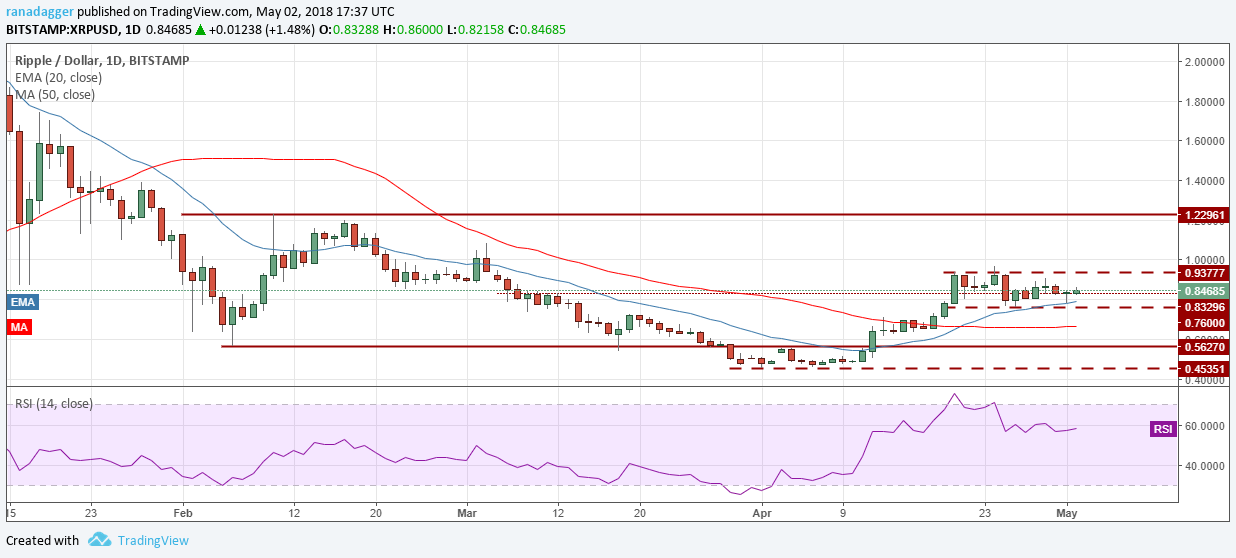
The XRP/USD pair will rally towards $1.229 levels if it breaks out and closes (UTC) above $0.94. On the other hand, it will become negative and slump towards the 50-day SMA and below that to $0.56 levels if it breaks down of $0.76.
Inside the range, it will remain volatile. We’re waiting for the breakout to recommend any long positions.
Stellar
Stellar is currently holding close to the overhead resistance at $0.47766719. The rounding bottom pattern will complete on a breakout and close (UTC) above this level. It can also dip a little and form a cup and handle formation. Both these formations are bullish.
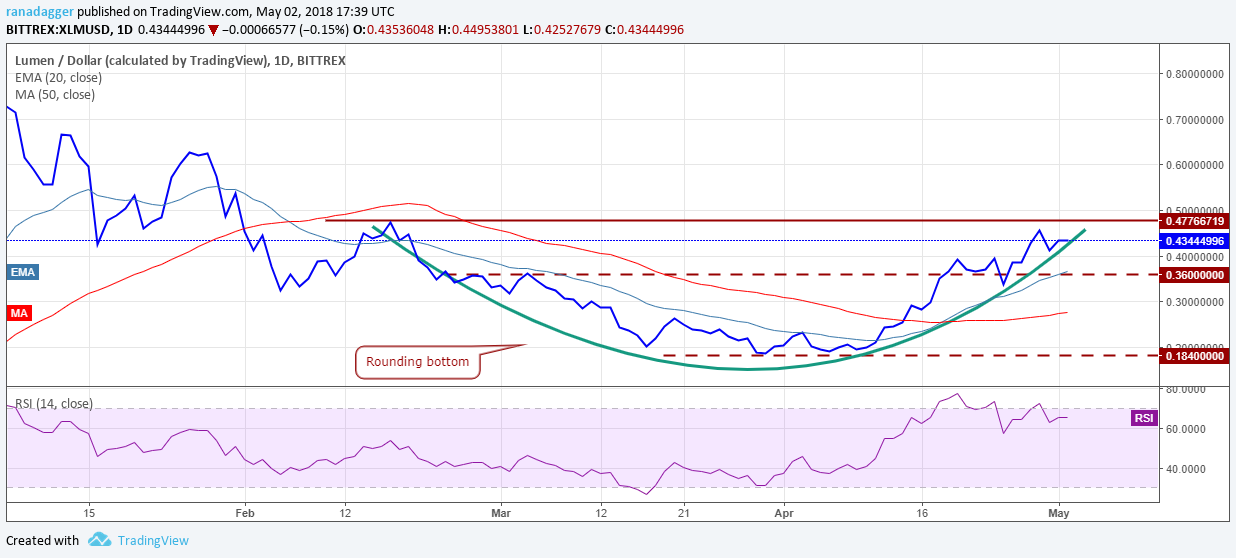
If the XLM/USD pair fails to cross above the resistance level, it can correct towards the 20-day EMA where buyers should step in.
The only thing we’re worried about is the negative divergence on the RSI. Therefore, the breakout will be a time for is to talk about long positions.
Litecoin
Litecoin continues to trade in a tight range. It took support at the 50-day SMA on May 01. Though the support levels are holding, failure to rally shows lack of buying at higher levels.
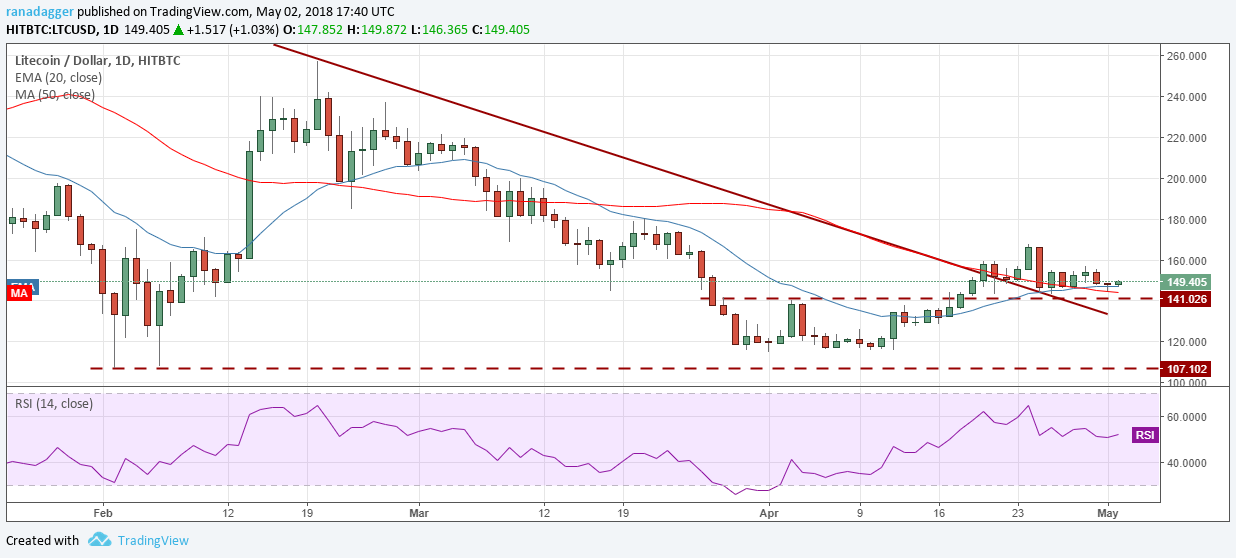
If the LTC/USD pair fails to climb up soon, it might break below the $141 level and slide towards $127. Therefore, we suggest retaining the stops at $140.
We shall close the position if we don’t get a rally within the next two days.
The levels to watch on the upside are $160 and $180.
Cardano
As expected, Cardano successfully retested the breakout levels of 0.00003445 and has resumed its uptrend. We had recommended traders to initiate long positions in our previous analysis.
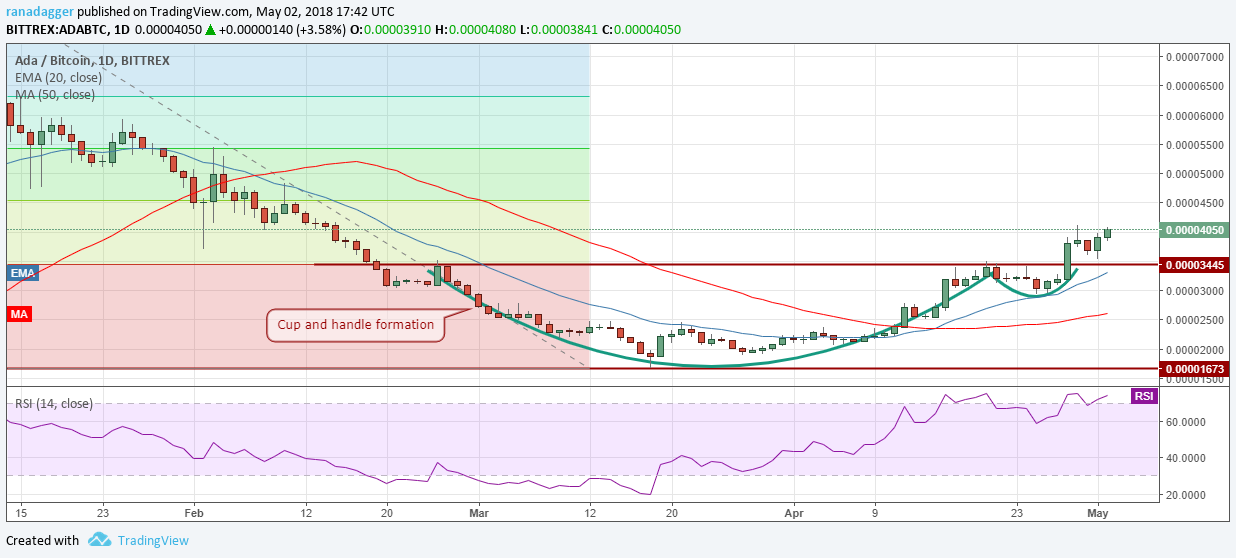
We shall continue to hold the long positions with the stops at 0.000029. Once prices move above 0.000042 levels, traders can raise the stops to 0.000033, just below the breakout level.
The ADA/BTC pair can rally to 0.000045 and above that to 0.00005217 levels.
Tron
Tron is currently facing resistance at the $0.09229053 levels. In mid-January of this year, it had also faced a strong resistance at the same level. The RSI is in overbought territory, which suggests a possible consolidation or correction.
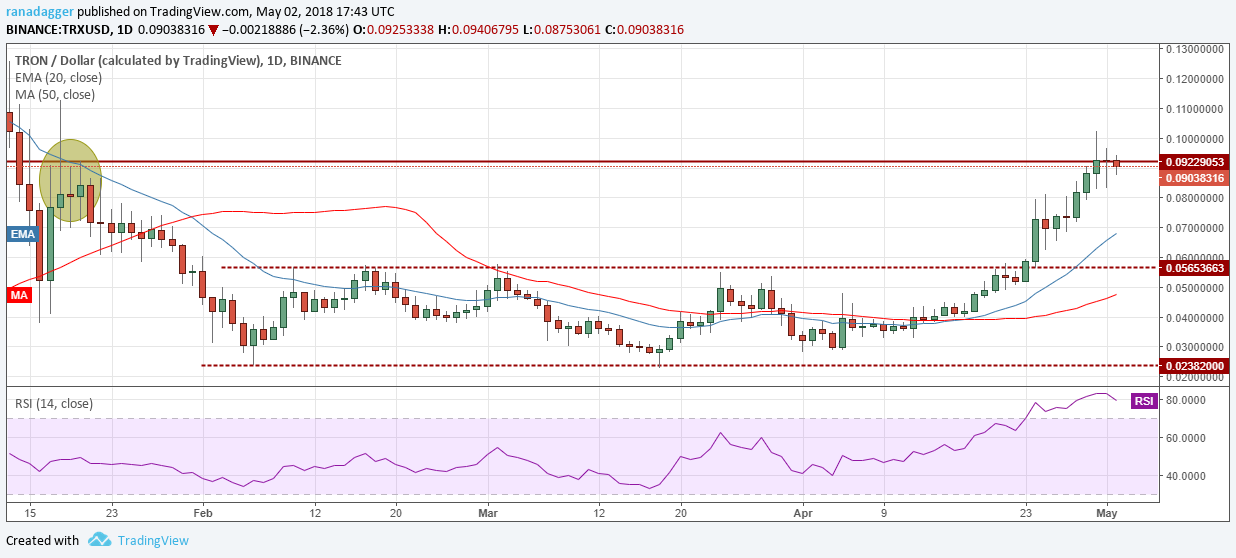
If the TRX/USD pair doesn’t give up much ground, it is a sign of strength. We expect the bulls to buy the dips closer to $0.08 levels. On the upside, a breakout and close (UTC) above the $0.093 levels will indicate the probable start of a new uptrend.
We shall wait for a couple of days to get a better picture and then suggest a buy.
EOS/USD
EOS found support at the 38.2 percent Fibonacci retracement levels of the recent rally from $5.961 to $23.0290. This shows strength because the bulls have defended the first support level.
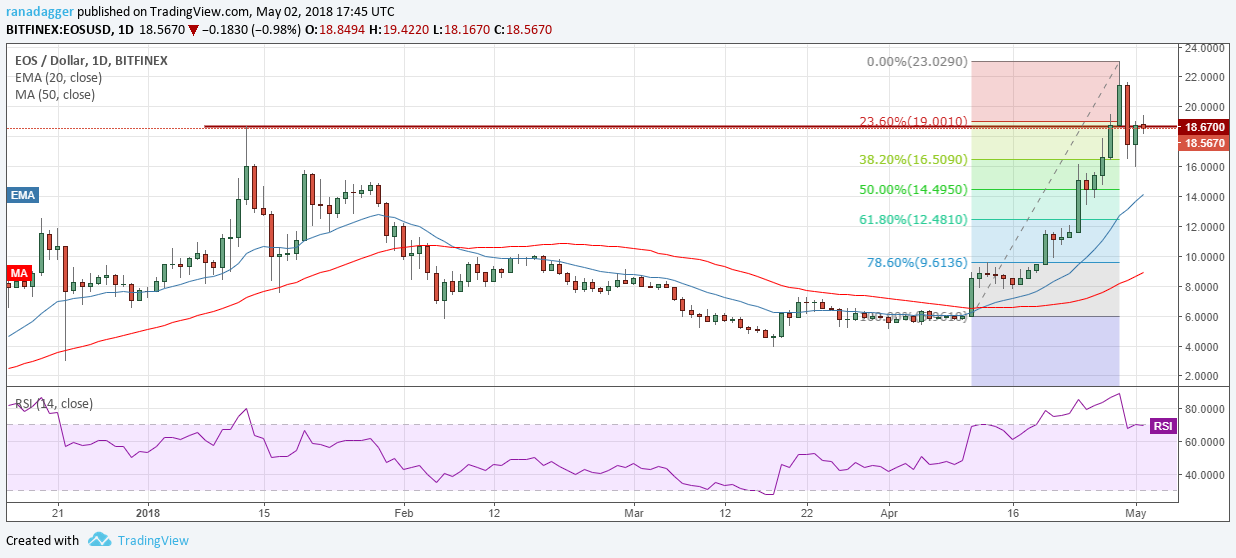
Though the trend is bullish, we believe that after such a stupendous rally, the EOS/USD pair will enter into a period of consolidation. It might become range bound between $16 and $23.
Therefore, we’re watching it for a few days and then initiate a long position if we find a reliable trade setup.
The market data is provided by the HitBTC exchange. The charts for the analysis are provided by TradingView.
