The views and opinions expressed here are solely those of the author and do not necessarily reflect the views of Cointelegraph.com. Every investment and trading move involves risk, you should conduct your own research when making a decision.
The market data is provided by the HitBTC exchange.
The total market capitalization of the cryptocurrency industry reached $832 bln on January 07 this year, along with the talks of how it would reach $1 trln in 2018.
Fast forward three months and the market cap is down to $255 bln, a fall of about 68 percent from the achieved highs. Some analysts believe that the selling might intensify by mid-April as many will be forced to raise money to pay taxes on the gains they earned in 2017.
Analysts attribute the fall to tightening regulatory concerns around the globe and the ban on cryptocurrency-related ads by the various social media platforms.
Currently, the sentiment is negative, and it might send cryptocurrencies prices lower.
Much has been written about the dreaded “death cross” on Bitcoin, when the 50-day moving average will cross below the 200-day moving average. However, it is such a widely watched event that it might work as a contrary indicator. After all, traders who had purchased after the last death cross in September 2015 around the $230 mark smiled away to their banks as the price rose to $500 by November of the same year.
We are not suggesting to buy right away, but we believe that a bottom should be around the corner. Let’s watch the critical levels on the top cryptocurrencies.
BTC/USD
Bitcoin has broken below our stop loss of $7,600, and our position initiated at $8,800 has been closed. We had suggested long positions because we anticipated a pullback once the digital currency broke out of the descending channel, but we were wrong.
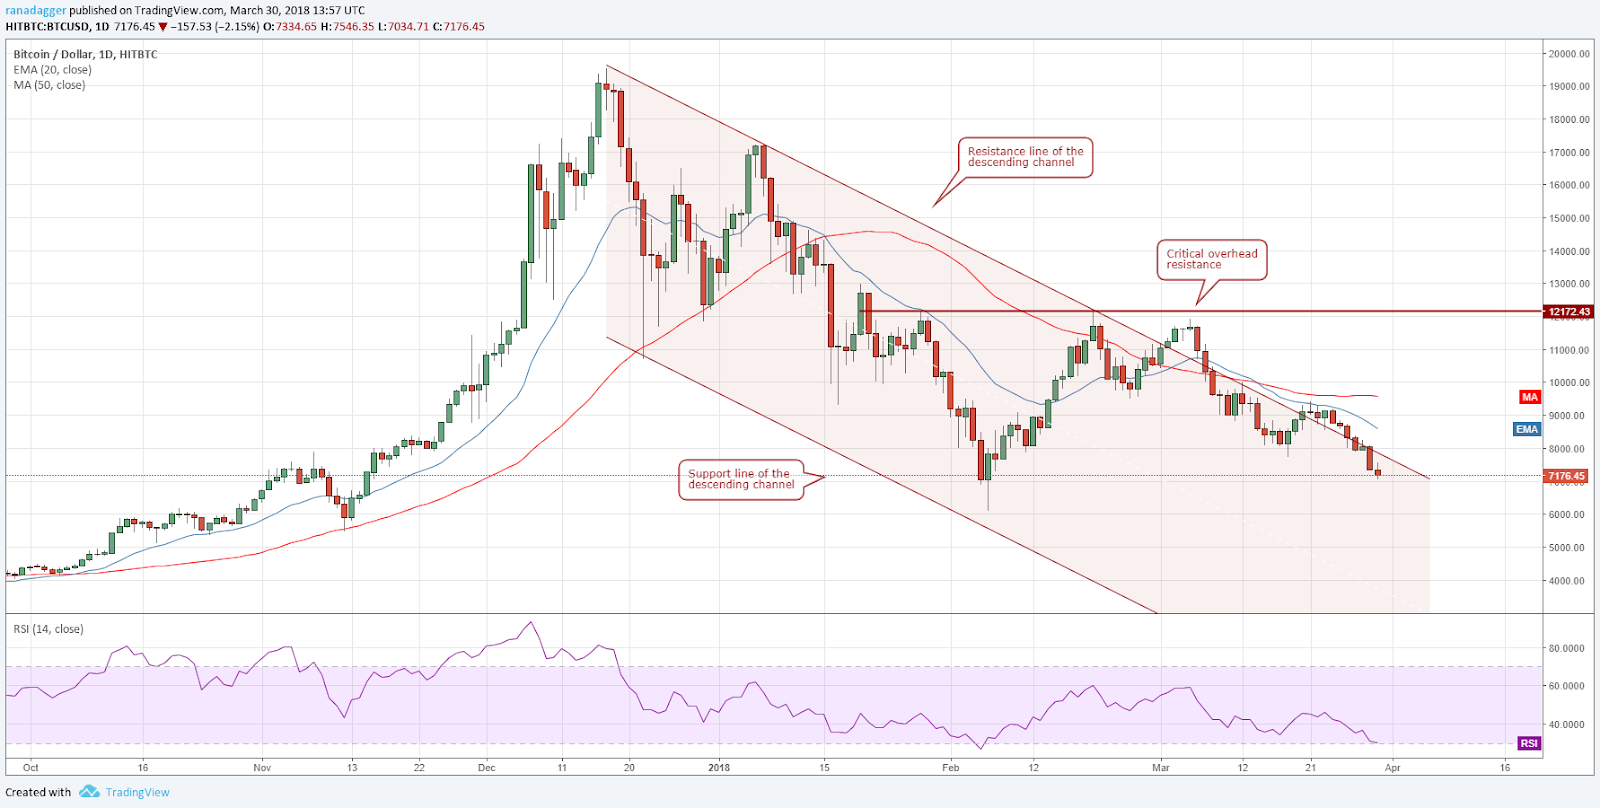
The bears strongly defended the 20-day EMA and pushed prices back into the descending channel once again.
There is a minor support at $7,000 below which the BTC/USD pair will retest the February 06 lows of $6,075.04.
However, traders should keep an eye on the relative strength index (RSI), which is entering the oversold territory. Previous declines to the oversold zone have turned out to be a good buying opportunity. Over the next couple of days, if we get a panic dip towards $6,000 or below that to $5,450.86, it might turn out to be a good place to buy for the long-term.
Investors should watch for prices to stabilize for about four hours and then purchase about 25 percent of the desired allocation. Panic dips, after a prolonged downtrend, should be used to invest. We expect the $5,000 to $6,000 zone to offer a strong support.
ETH/USD
Ethereum continues to be under pressure. The bulls have failed to even pull back to the 20-day EMA since March 05, which shows complete dominance by the bears. This has resulted in the RSI plunging deep into the oversold territory.
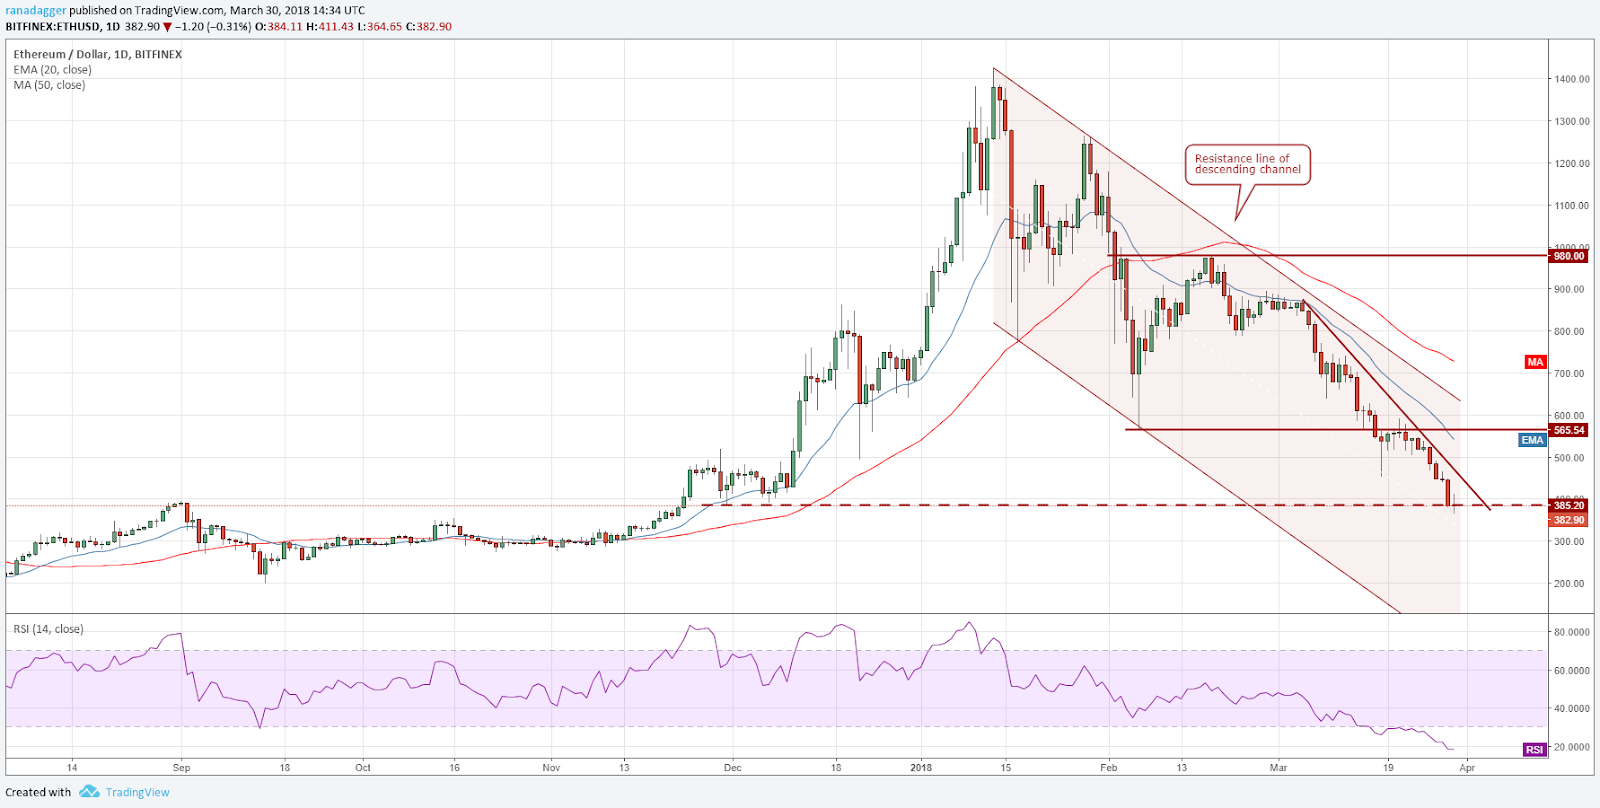
The ETH/USD pair is currently at the strong support zone of $355 to $385. If this support breaks, the next support zone is between $275 and $300.
As the RSI is oversold, we expect a relief rally that can reach the downtrend line. Once above this, a move to the 20-day EMA is possible.
We should watch for a couple of days before suggesting any long-term positions.
BCH/USD
Bitcoin Cash broke below the February 06 lows of $778.2021 on March 29. The next support is way lower at the $558 to $600. This level coincides with the support line of the descending channel and the horizontal support. We might see a relief rally from this strong support zone.
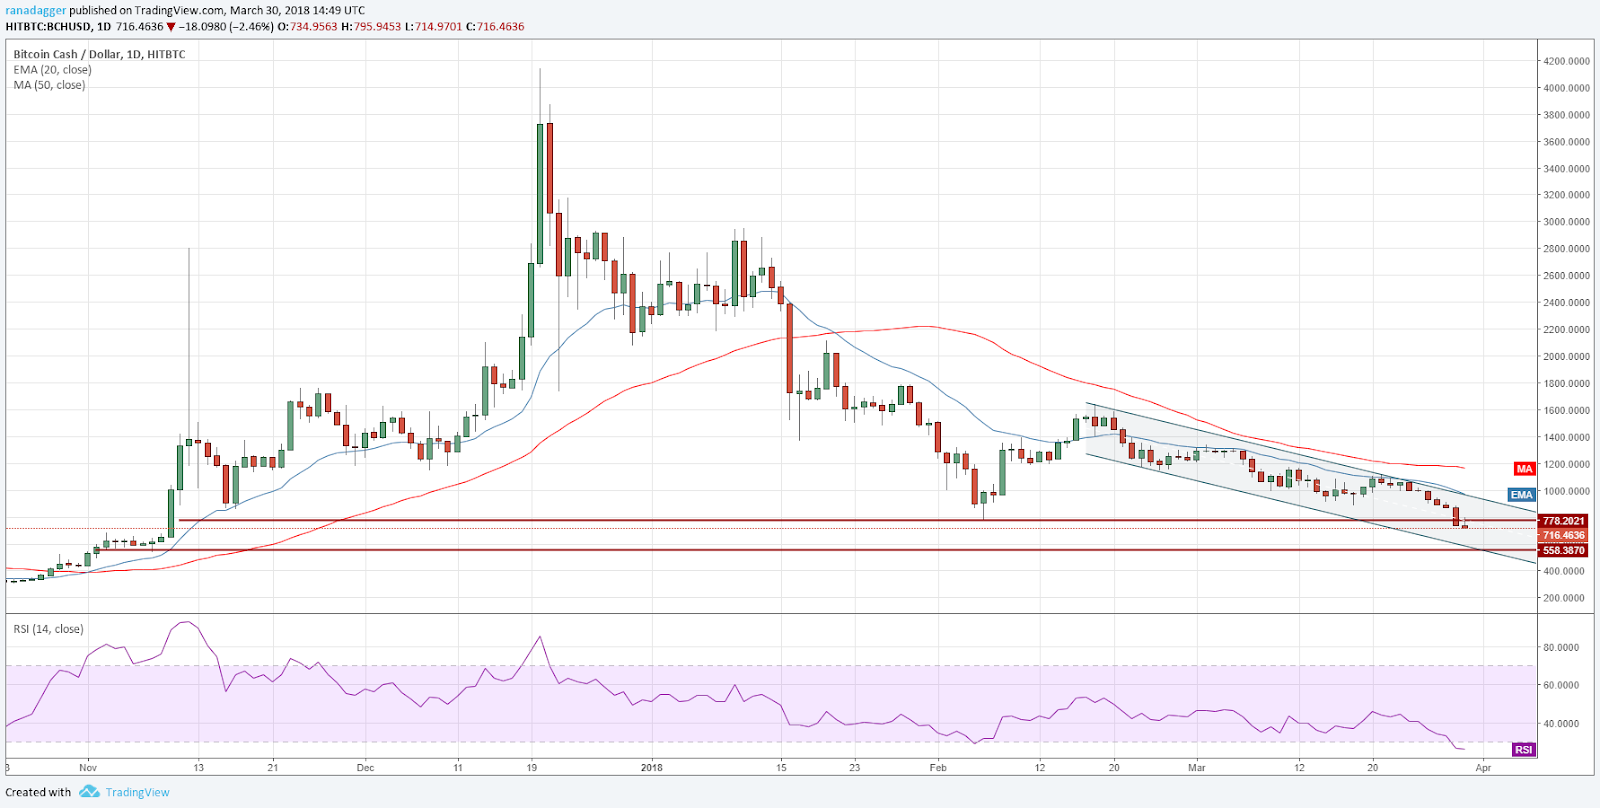
The RSI in the oversold zone also supports the possibility of a pullback, however, the BCH/USD pair will face selling at the 20-day EMA, which is right at the resistance line of the descending channel.
We recommend waiting for the virtual currency to stop falling before suggesting any trades.
XRP/USD
Our stop loss in Ripple was hit when the price fell below $0.52 levels on March 29. We had expected the $0.56270 levels to hold, but we were wrong.
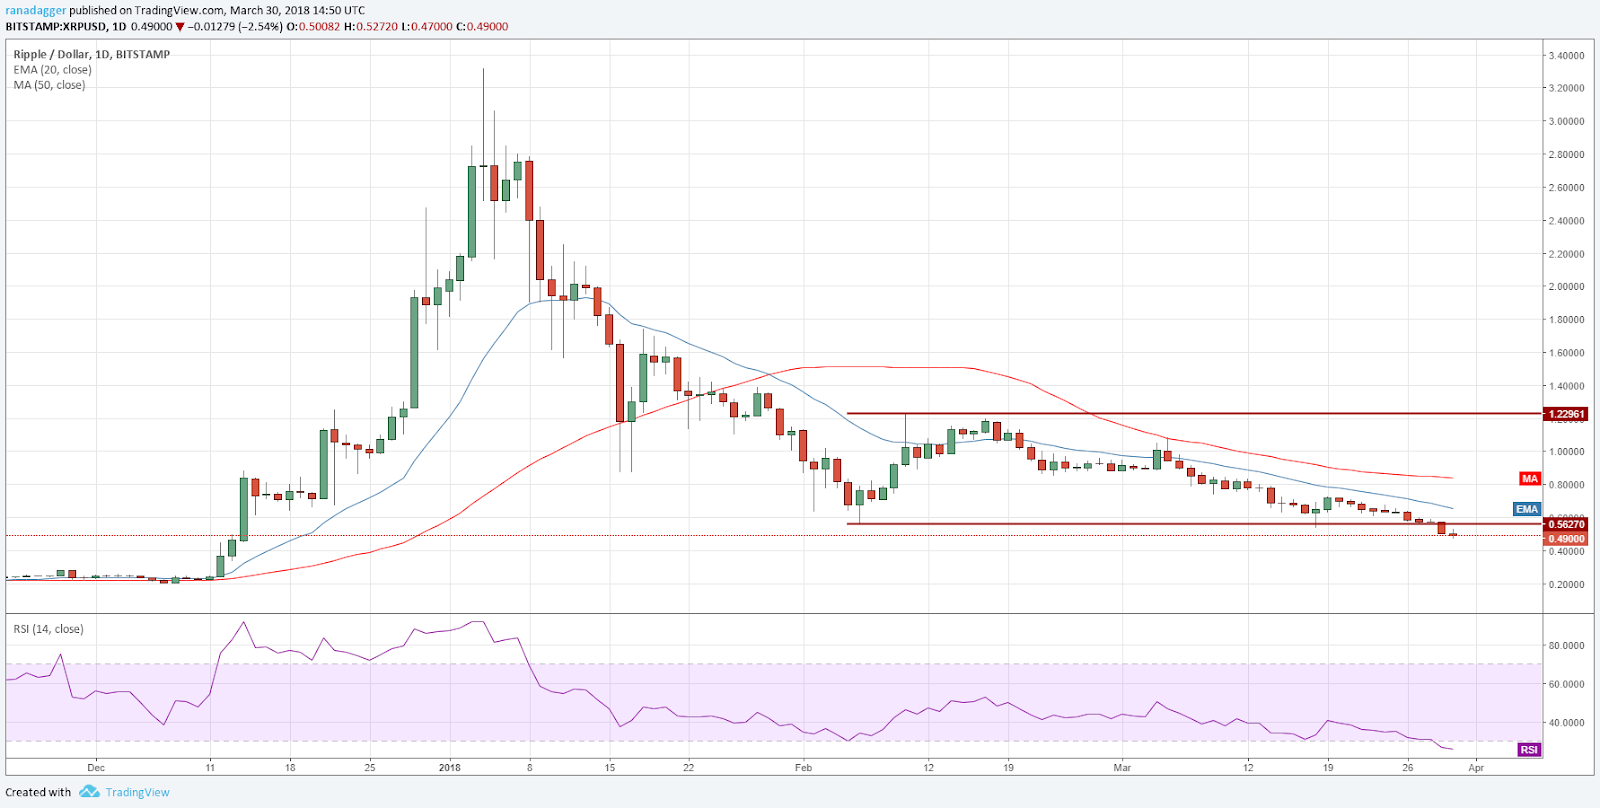
The next major support level on the XRP/USD pair is way lower at $0.22. The lower target levels will be invalidated if the bulls quickly push prices above $0.57 levels. Until then, all pullbacks will be sold into.
We recommend a buy when we find a particular level holding for a couple of days.
XLM/USD
Stellar has broken below the immediate support of $0.20. It is currently trying to take support on the downtrend line.
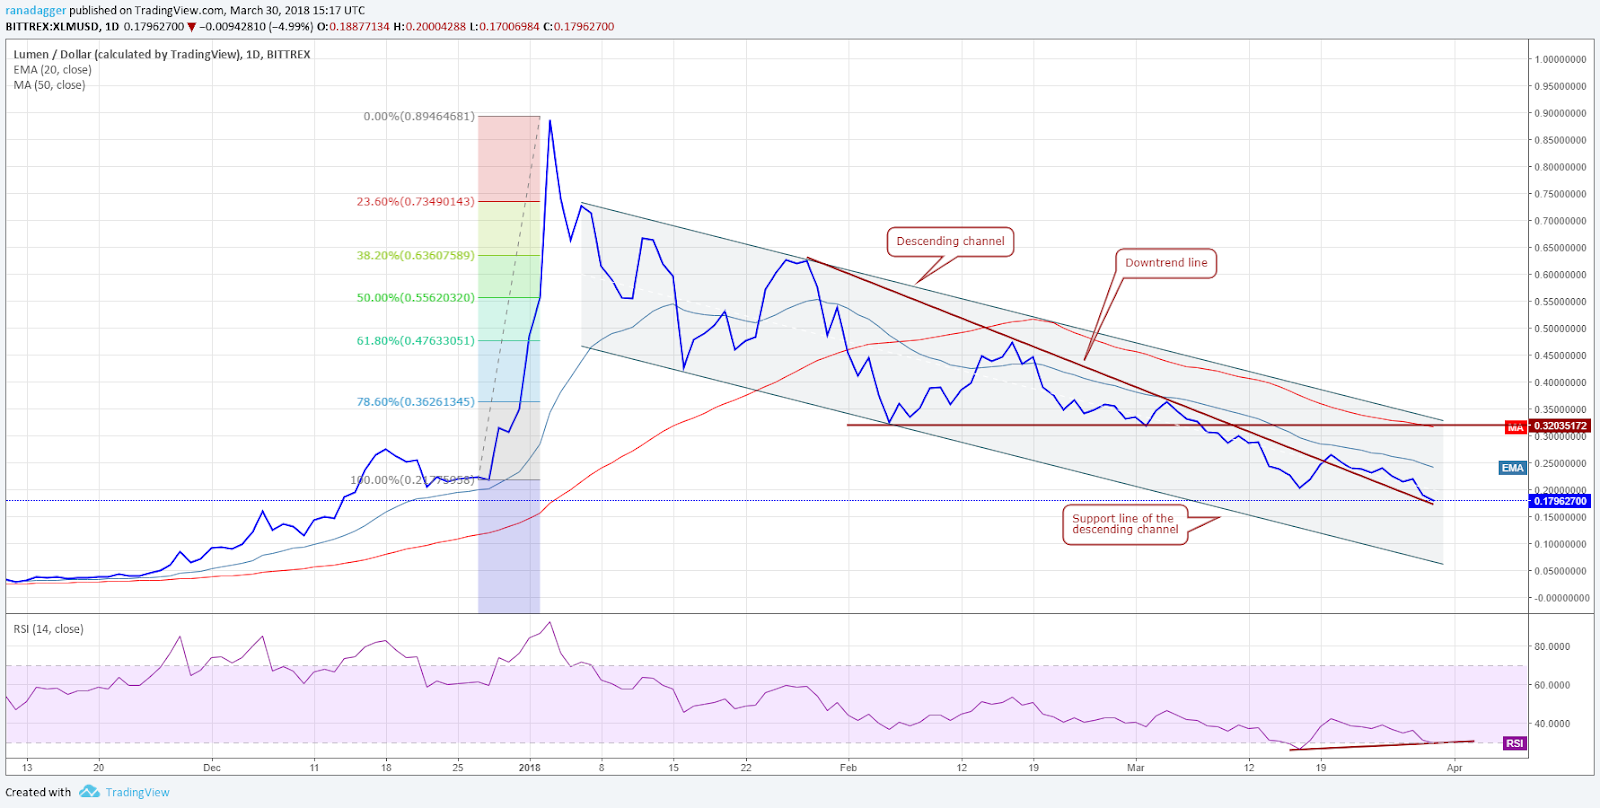
If this support breaks, the XLM/USD pair can slide to $0.16 and below that to $0.11 levels. Here, the RSI is showing a positive divergence, but we need to wait for the price to turn up before putting any long position on it.
LTC/USD
Litecoin could not hold the trendline of the symmetrical triangle. It, now, has support at the February 02 lows of $107.102.
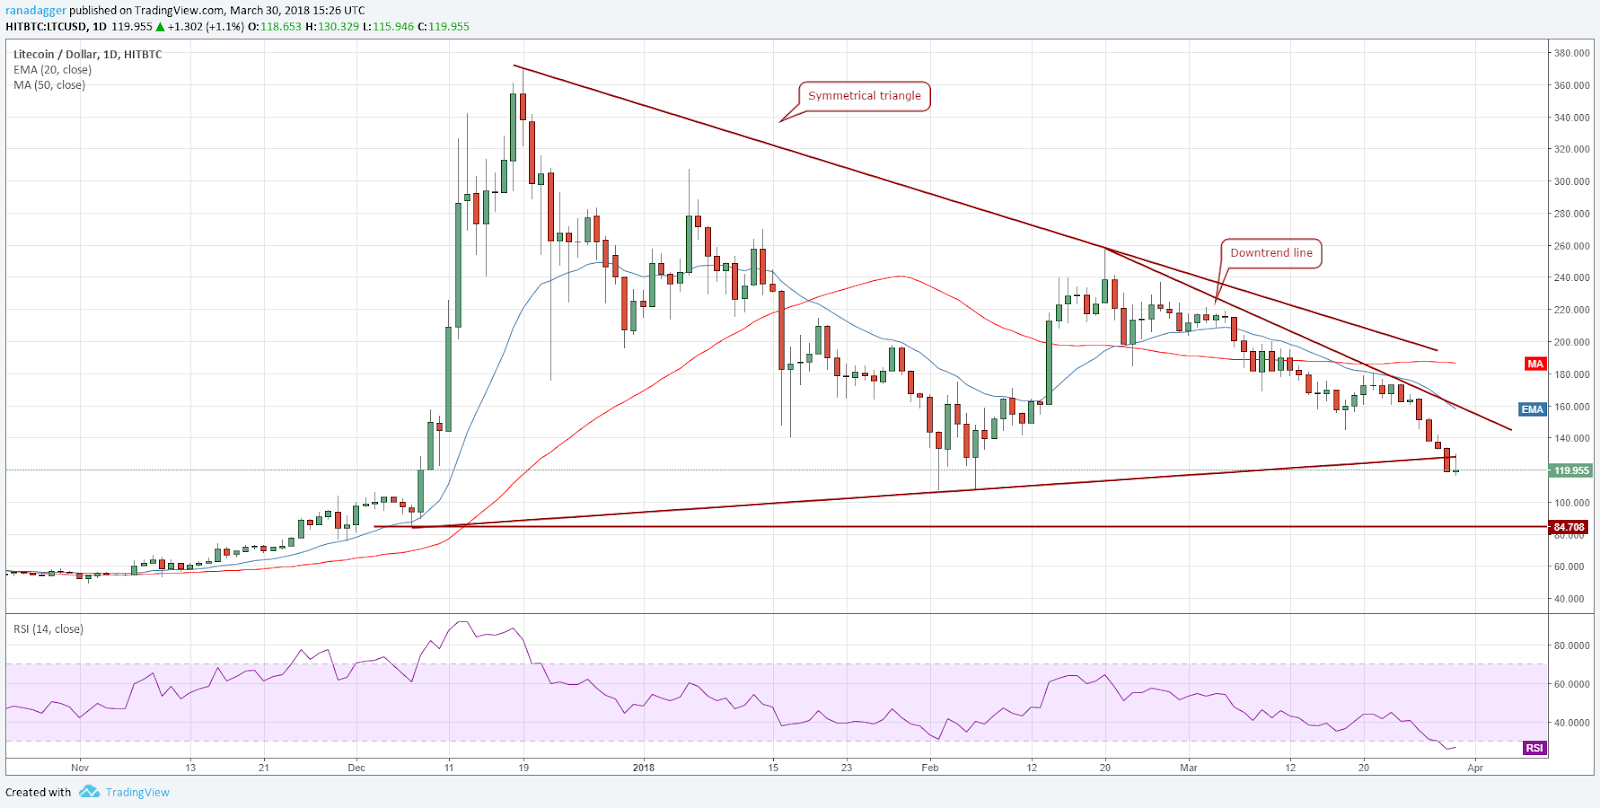
If that level also breaks, the LTC/USD pair can slide to $84.708. The RSI is in the oversold zone. We can expect a relief rally soon, but we don’t find any buy setup now, hence, we do not recommend any trading position.
ADA/BTC
While most top cryptocurrencies have continued to break down of critical support levels, Cardano has held its own.
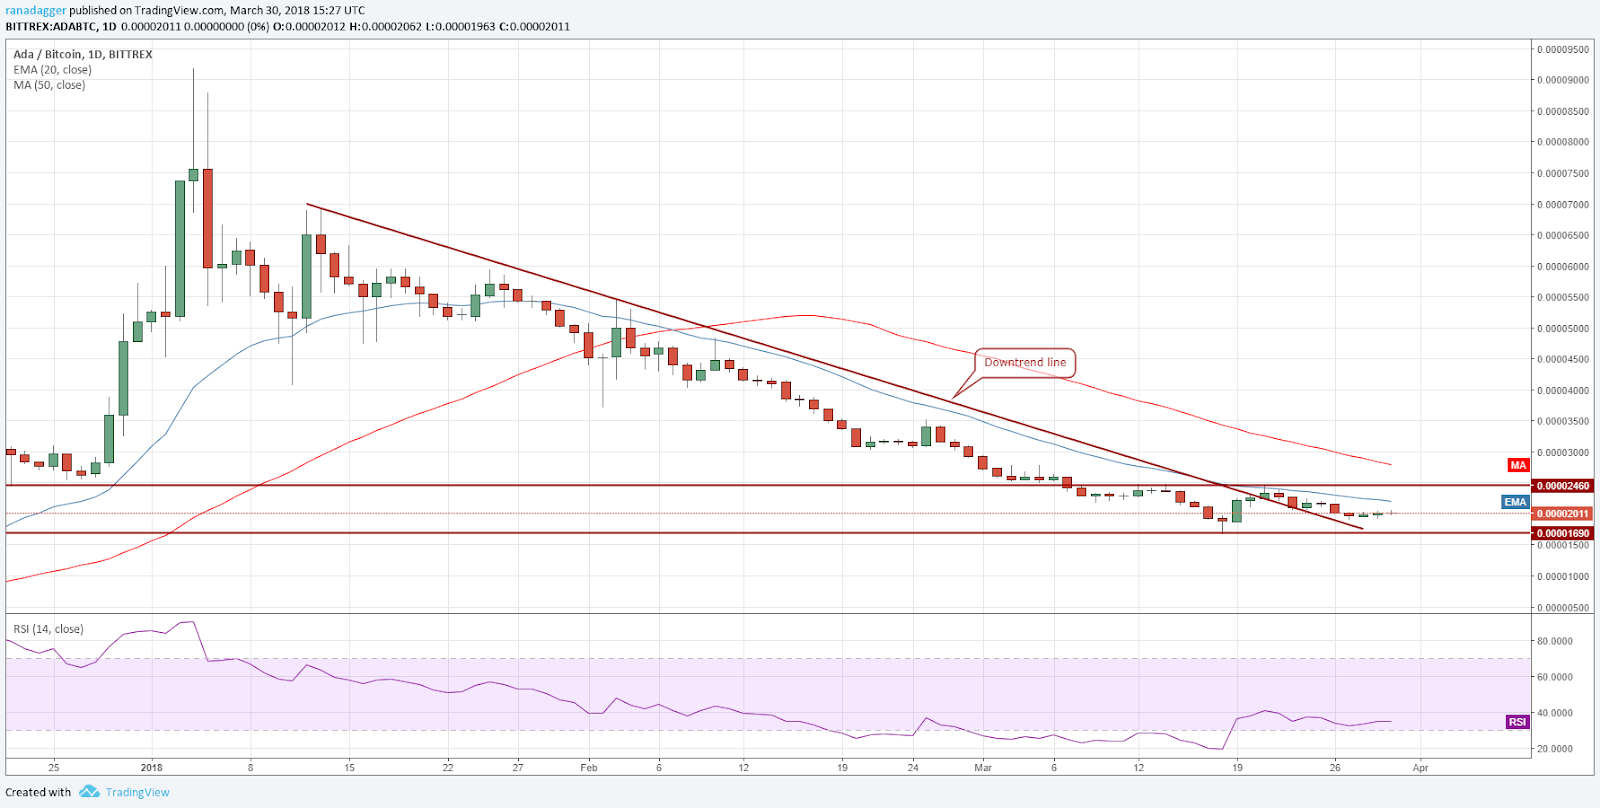
We expect the ADA/BTC pair to remain within the range of 0.00001690 and 0.00002460 for the next few days.
We suggest a buy position once prices close above 0.00002460 levels.
NEO/USD
NEO is trading at the critical levels of $49.04, which is the March 18 lows. If it breaks, there is no major support until the price reaches $31.15 levels.
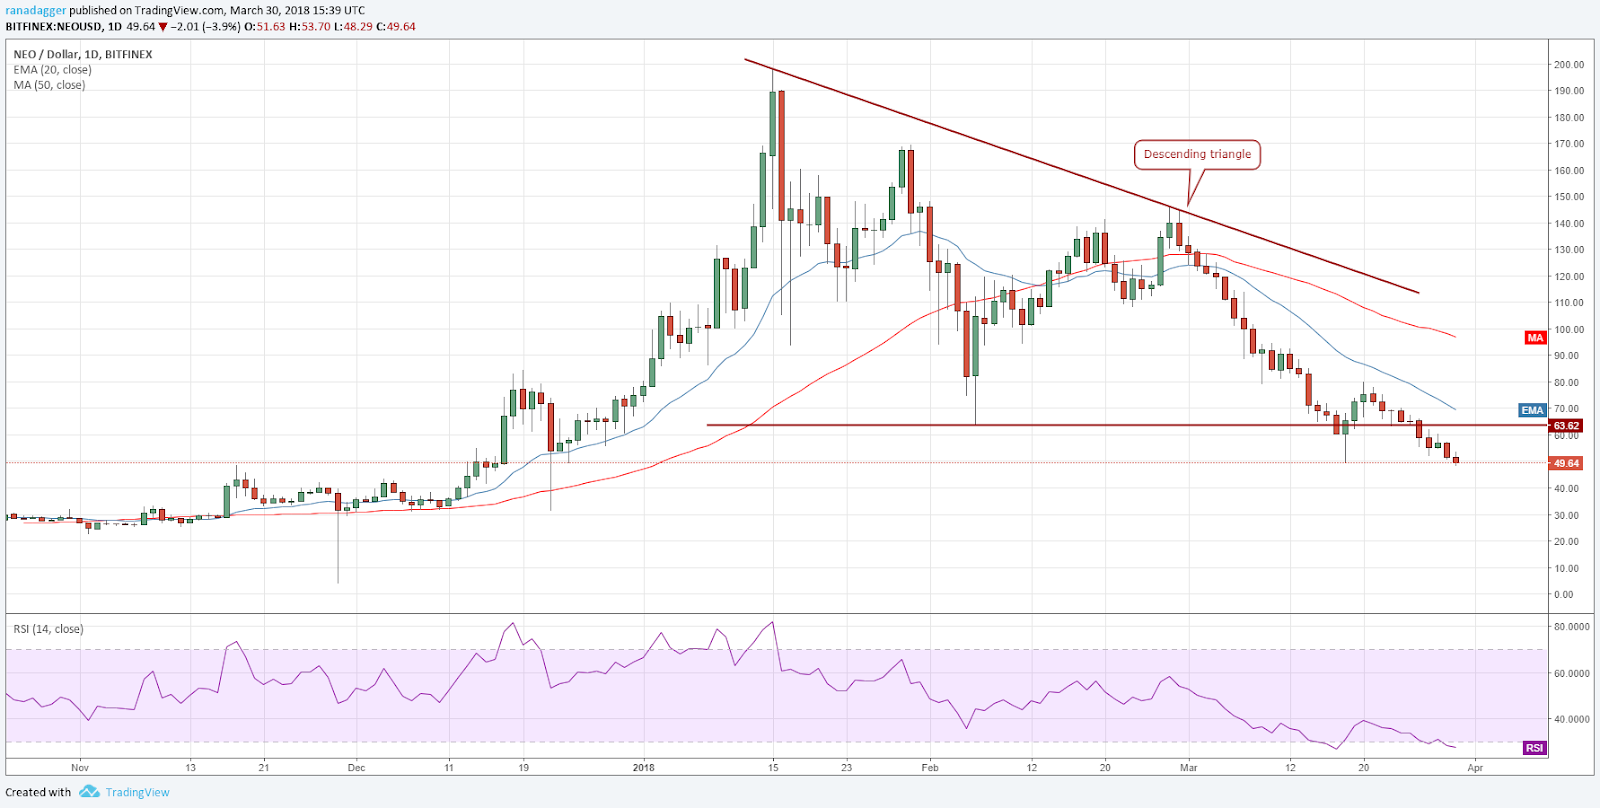
If the support holds, there can be a possibility of a double bottom formation. Our bearish view on the NEO/USD pair will be invalidated if the prices sustain above $65 levels.
EOS/USD
EOS continues to exhibit strength. Prices are trading close to the 20-day EMA. If the sentiment improves across the sector, we expect the virtual currency to break out of the resistance line of the descending channel.
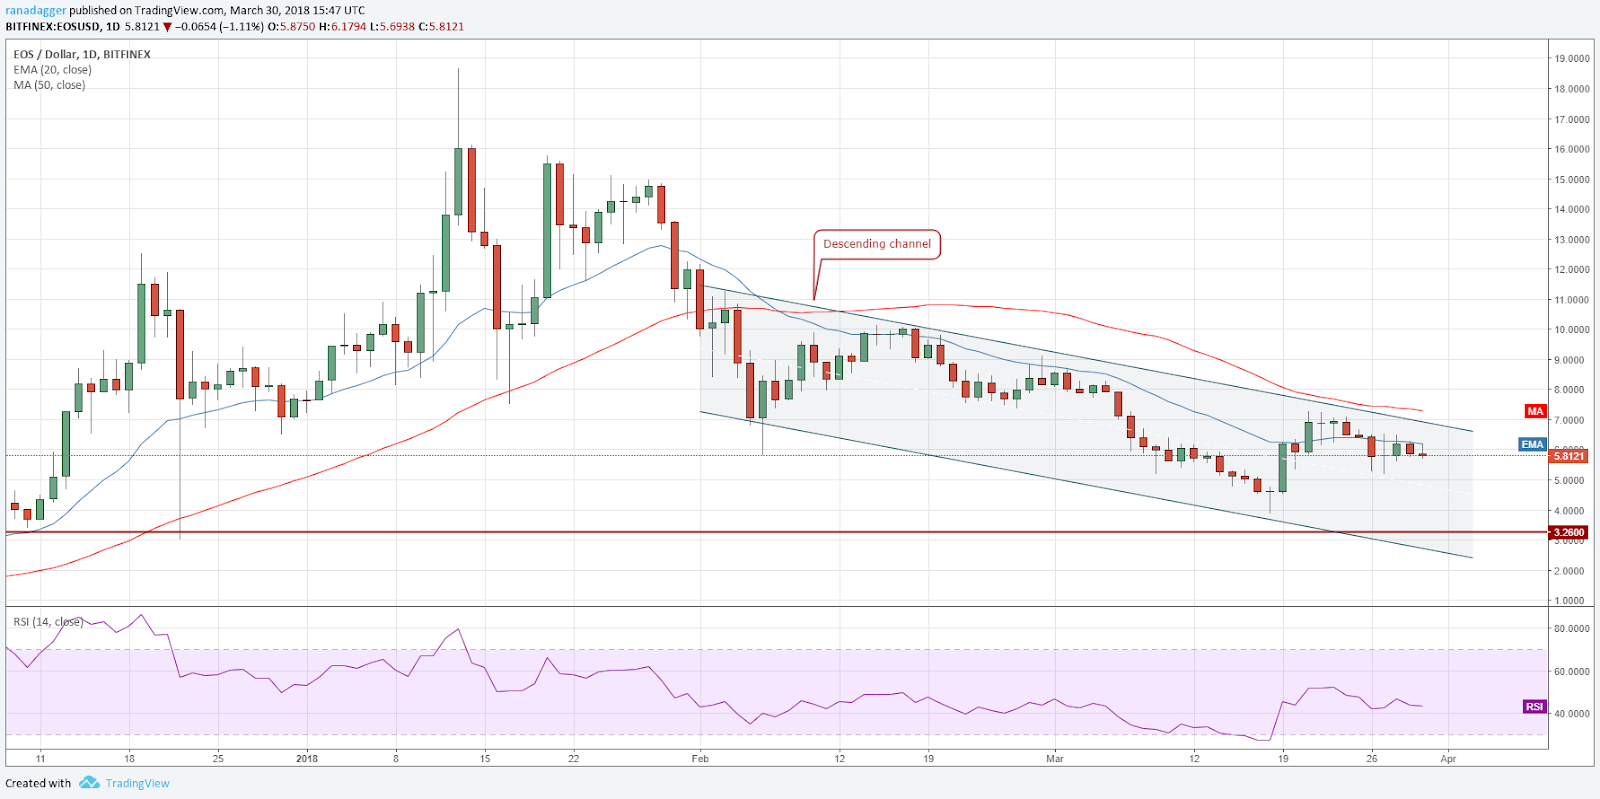
On the downside, $5.1801 is a strong support, below which a retest of the $4 levels might take place.
We retain the buy recommendation on the EOS/USD pair at $7.5, for a target objective of $11. The initial stop loss can be placed at $5.
The market data is provided by the HitBTC exchange. The charts for the analysis are provided by TradingView.
