The views and opinions expressed here are solely those of the author and do not necessarily reflect the views of Cointelegraph.com. Every investment and trading move involves risk, you should conduct your own research when making a decision.
The market data is provided by the HitBTC exchange.
The question whether the American regulators classify Ethereum as a security or not is taking center stage because it might have serious ramifications on the crypto world. Though it is not a decision that will be made in a hurry, still, the news will be keenly watched because of its possible widespread impact.
At the same time, the increased regulations in Japan and Hong Kong are forcing the cryptocurrency exchanges to shift to more regulatory friendly nations.
Korea is another nation where the daily transactions of digital currencies have plunged due to various regulations. The new governor at the helm of South Korea’s Financial Supervisory Service (FSS) sees “some positive aspects” to digital currencies. However, what he does to support the crypto world will be interesting to see.
Nick Colas, the Wall Street brokerage analyst who started covering Bitcoin (BTC) in 2013, believes that investors should not buy Bitcoin at the current prices.
We, on the other hand, believe that most of the top cryptocurrencies are forming bottoms. Though it may not be a vertical road to recovery, they will offer enough opportunities to trade. Let’s see the ones we like today.
BTC/USD
Bitcoin could not break out of $10,000 on May 05 and May 06. Later, prices turned around and broke below the support line of the ascending channel, which is a bearish sign. Currently, the 20-day EMA has been offering a strong support. If this level holds, the bulls will again attempt to break out of the overhead resistance at $10,000 and rally to $12,000 levels with a minor resistance at $11,000.
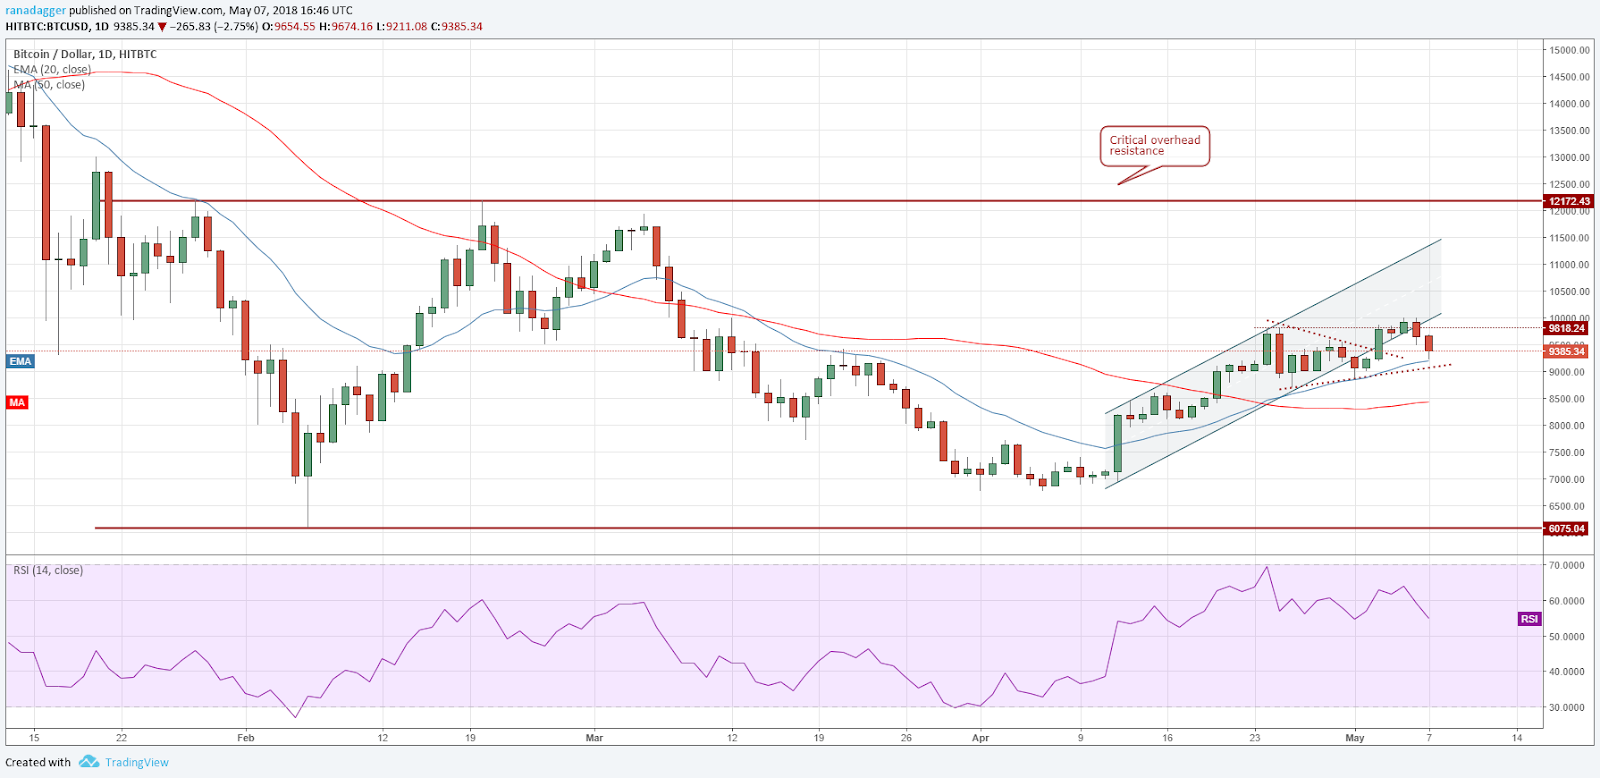
If the support zone between the 20-day EMA and $9,000 breaks, the BTC/USD pair can fall to the 50-day SMA at $8,500. Therefore, we suggest retaining the stops at $8,900.
If the $9,000 level holds, there is a possibility of an ascending triangle formation. Hence, we want to keep our positions open with a stop loss below which the probability of a slide increase.
ETH/USD
Our proposed buy on Ethereum was triggered on May 06 when it declined close to the breakout levels. However, today, prices have slumped below the breakout level of $745, which is a bearish sign.
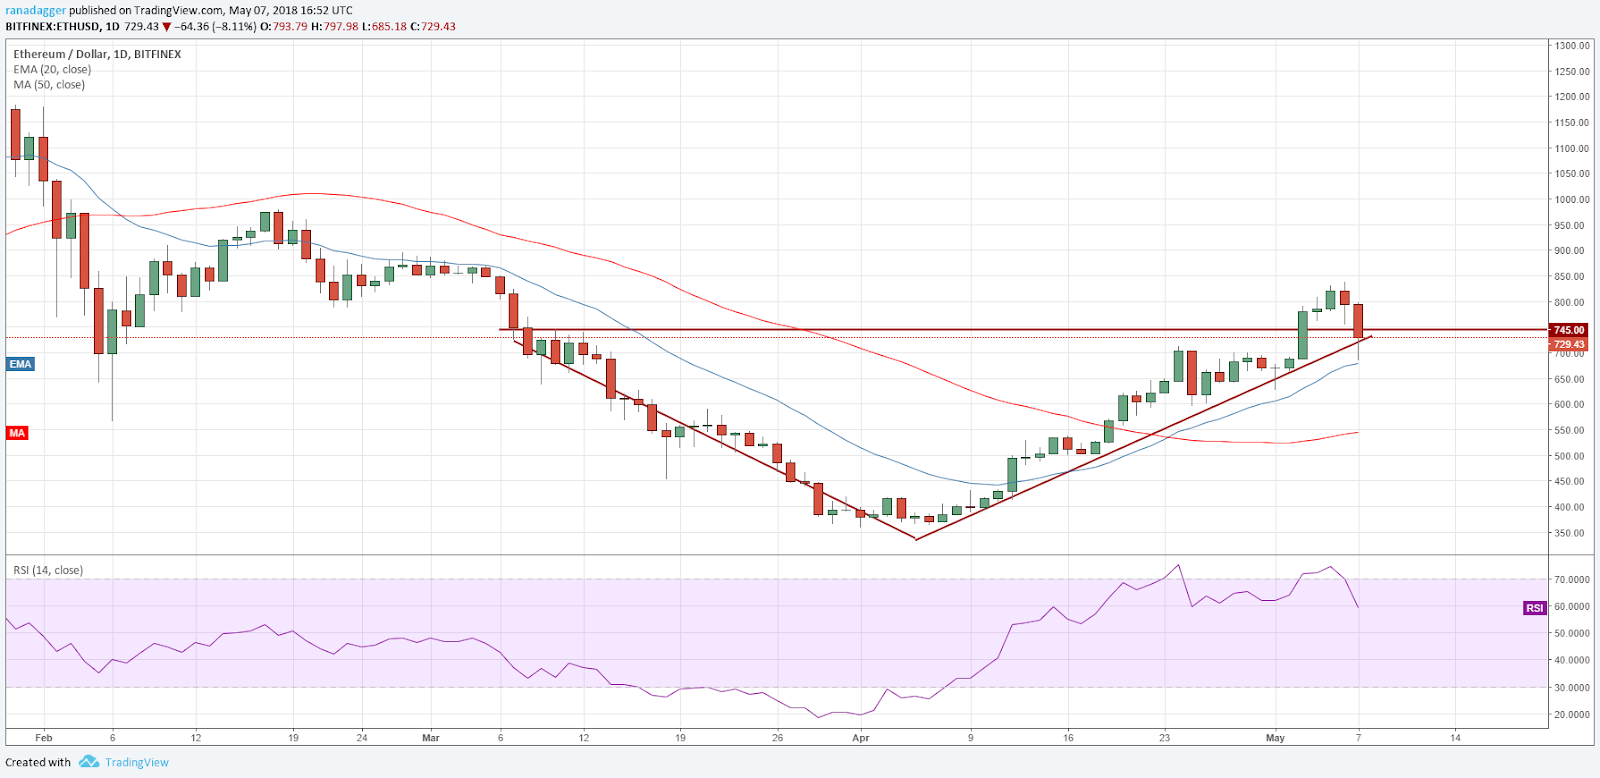
The small positive is that prices have bounced off the 20-day EMA. If the bulls can push the ETH/USD pair above $745 once again, a move towards the target objective of $1,130 is likely. It may face some resistance at $900 and $1,000, but we expect these levels to be crossed.
If the 20-day EMA breaks, a fall to $600 and below that to the 50-day SMA is possible. Therefore, we suggest maintaining the stops at $640.
BCH/USD
Bitcoin Cash broke out and closed (UTC) above the $1,600 levels on May 05, which triggered our buy recommendation. The stop loss was $1,400, and the target was $2,000.
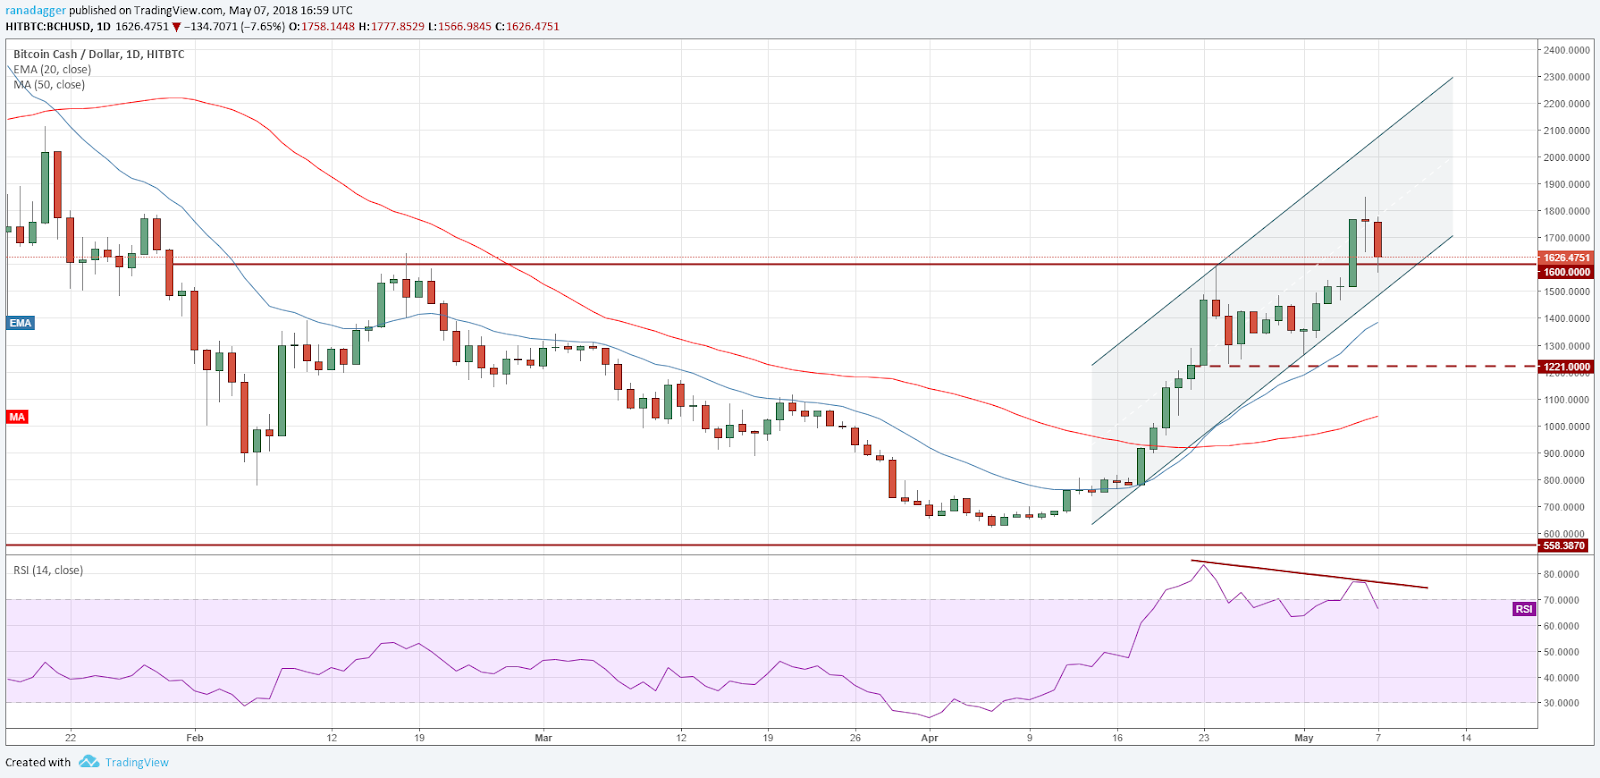
The BCH/USD pair has turned down sharply and is currently at the break out levels of $1,600. If this support holds, a move to $2,000 is possible.
If the digital currency breaks below $1,600 and the support line of the ascending channel, it can correct to the 20-day EMA.
The trade is looking weak, and the RSI is showing negative divergence. Therefore, we suggest raising the stops on half position to $1,500 and retaining the rest at $1,400.
XRP/USD
Ripple again failed to break out of the upper end of the range. It has turned down and is likely to decline to the lower end of the range at $0.76 because it is struggling to hold the 20-day EMA.
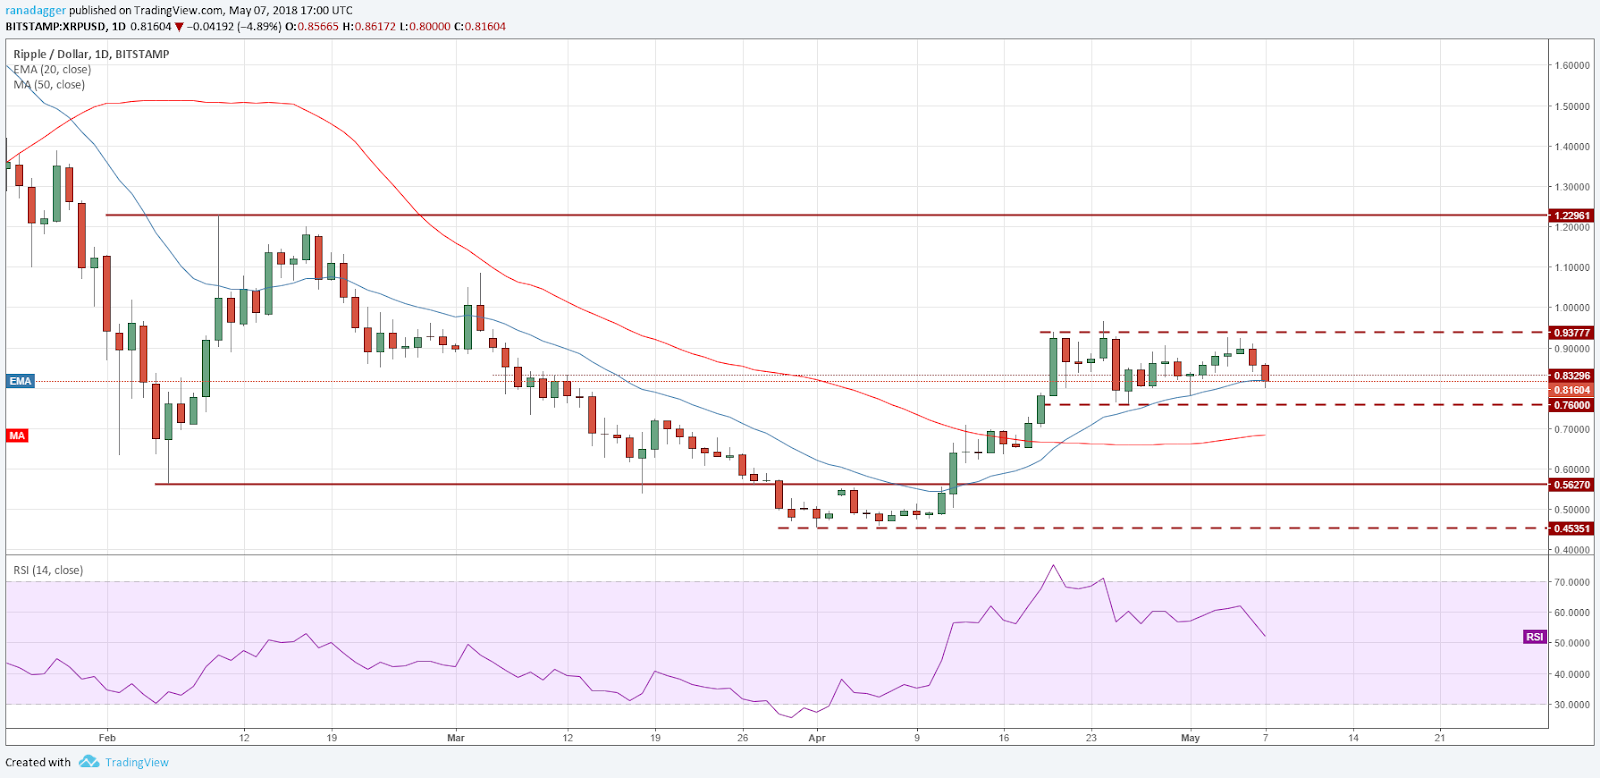
If the XRP/USD pair breaks below the range, it can slide to the 50-day SMA and below that to the $0.56270 levels.
If the support at $0.76 holds, it may remain in consolidation for a few more days. We shall turn bullish either on a break out of the range or if a new buy setup forms.
XLM/USD
Stellar has turned down from the overhead resistance of $0.47766719, invalidating the probable rounding bottom formation. Now, there is a possibility of a cup and handle formation, but the setup completes only after a breakout of the overhead resistance.
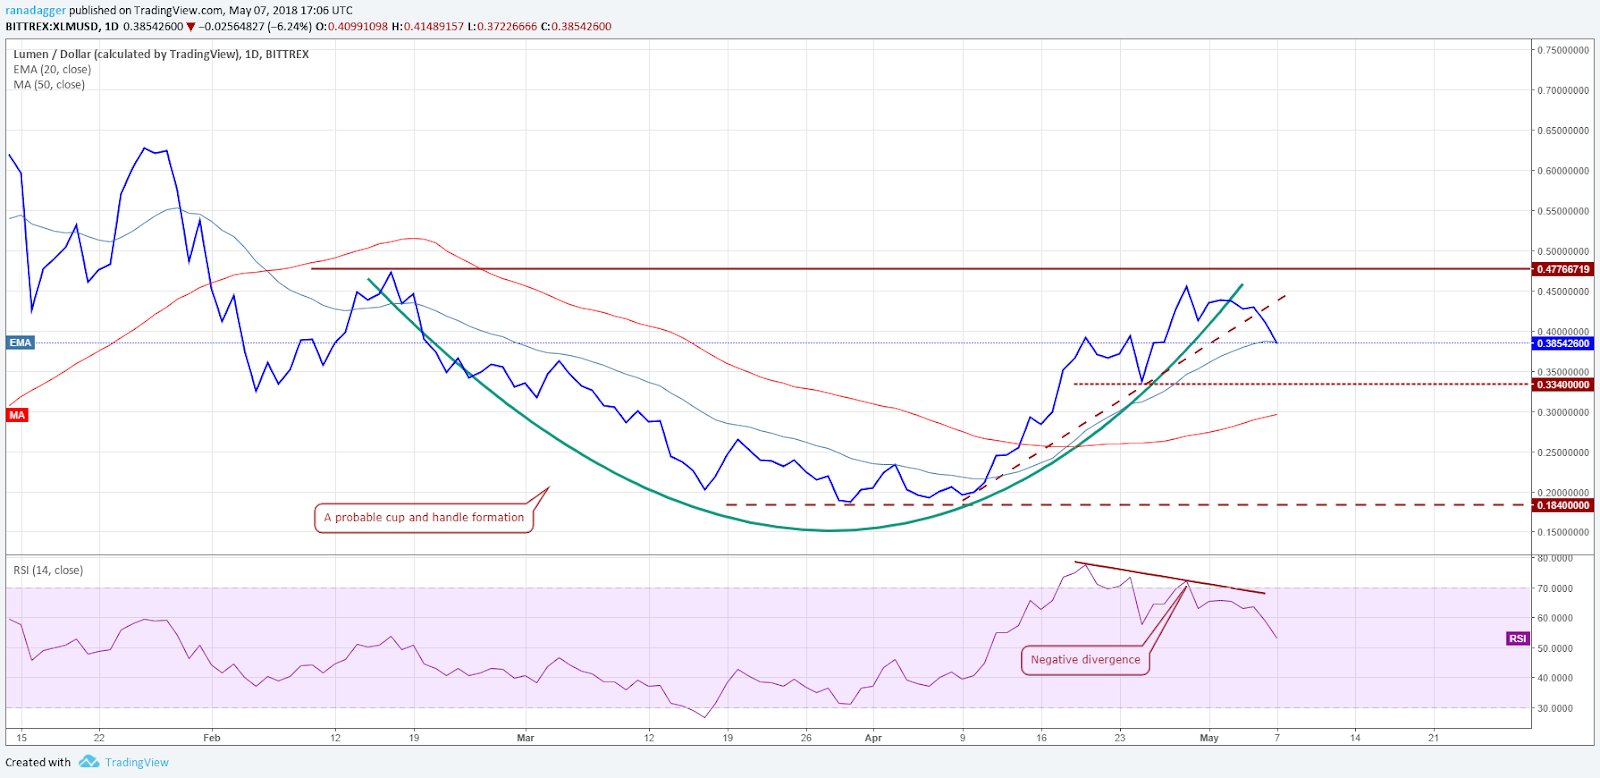
The XLM/USD pair should find support at the 20-day EMA and below that at the $0.334 levels. If both these levels break, the slide can extend to the 50-day SMA.
Therefore, we recommend waiting for the price to break out of $0.48 before initiating long positions.
LTC/USD
Litecoin reached our target objective of $180 on May 05 and May 06. Hopefully, the traders would have closed their long positions either by selling the complete position at $180 or by trailing the stops higher.
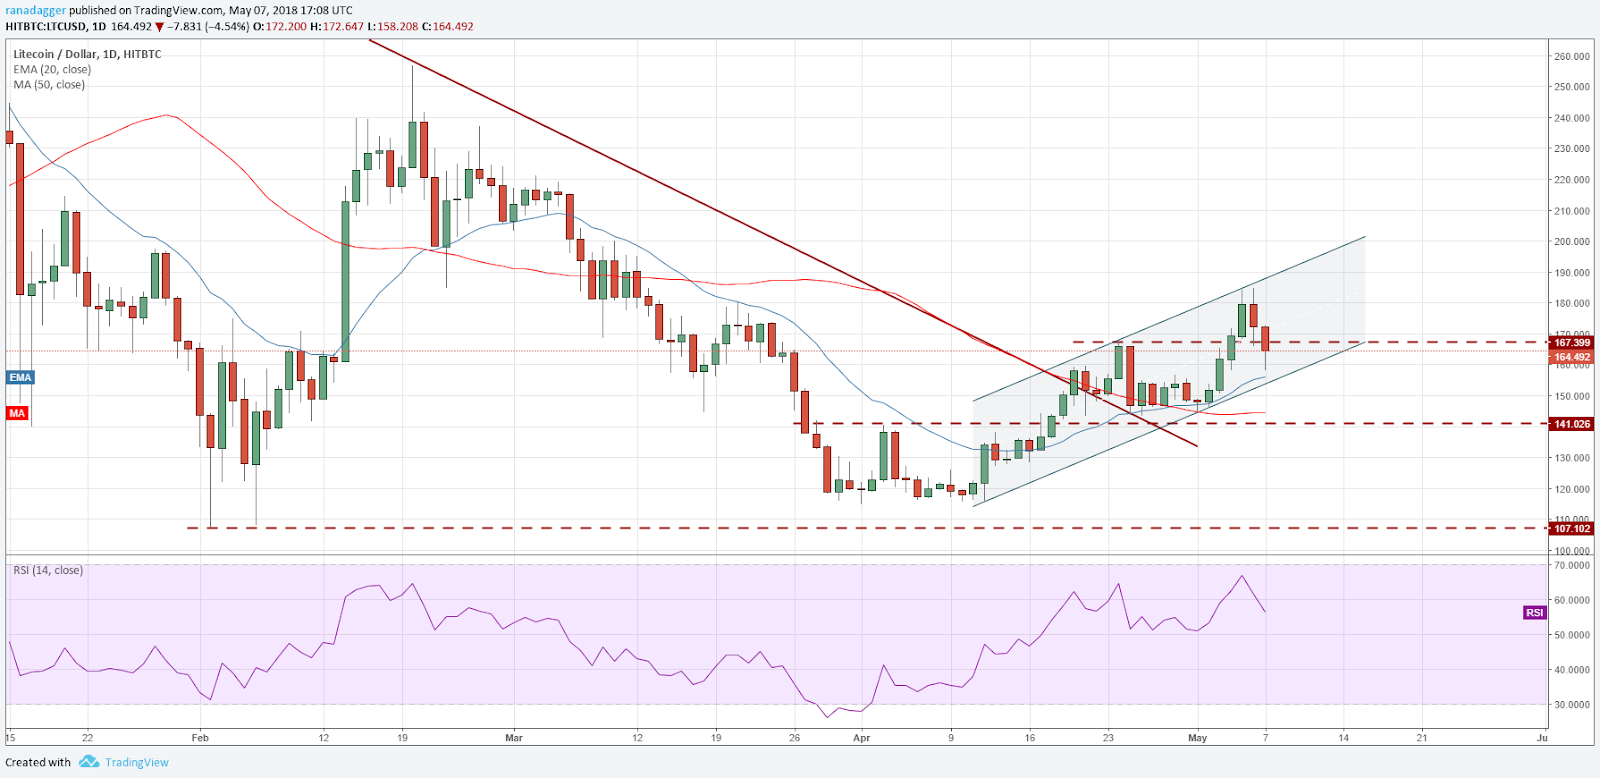
The LTC/USD pair is currently trading in an ascending channel. The support line of the ascending channel and the 20-day EMA, close to $155 levels should offer strong support.
We suggest waiting for a breakout above $168 before initiating long positions because a breakdown of $155 can sink the cryptocurrency to $143 levels.
ADA/BTC
Cardano has corrected back to the breakout levels of 0.00003445 which is critical support because the 20-day EMA, the trendline and the horizontal line all lie at the same place.
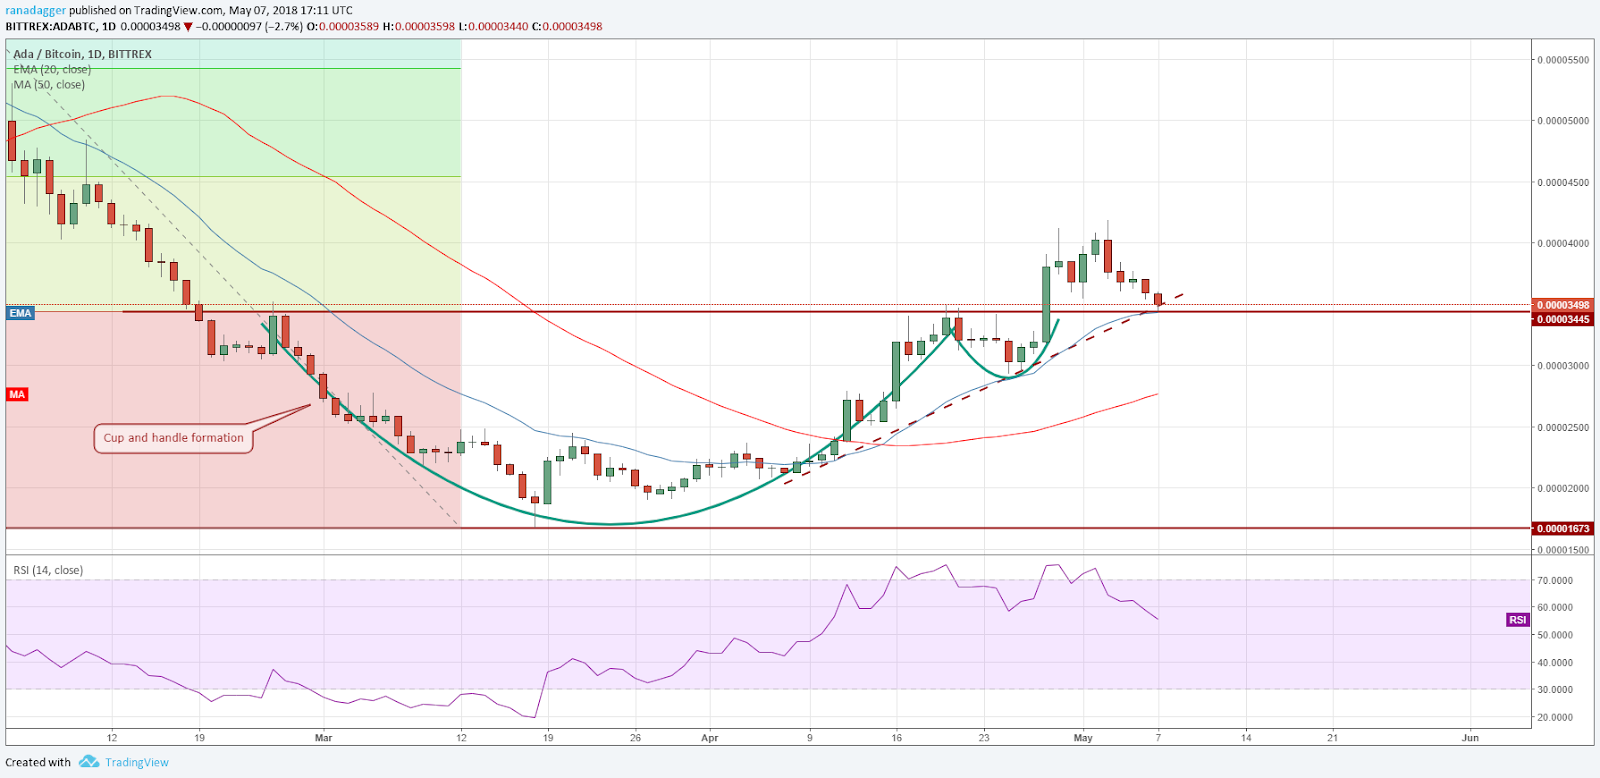
If the support holds, the ADA/BTC pair should attempt to resume its uptrend and rally towards its target objective of 0.000045 and 0.00005217.
Nevertheless, if the support breaks, it will indicate weakness and the digital currency can slide to the 50-day SMA. Though our suggested stop loss is currently at 0.000029 levels, we shall close the position if we find the price sustaining below 0.000034 levels.
IOTA/USD
The breakout in IOTA above the overhead resistance of $2.2117 on May 02, has proven to be short-lived as prices have declined back into the range.
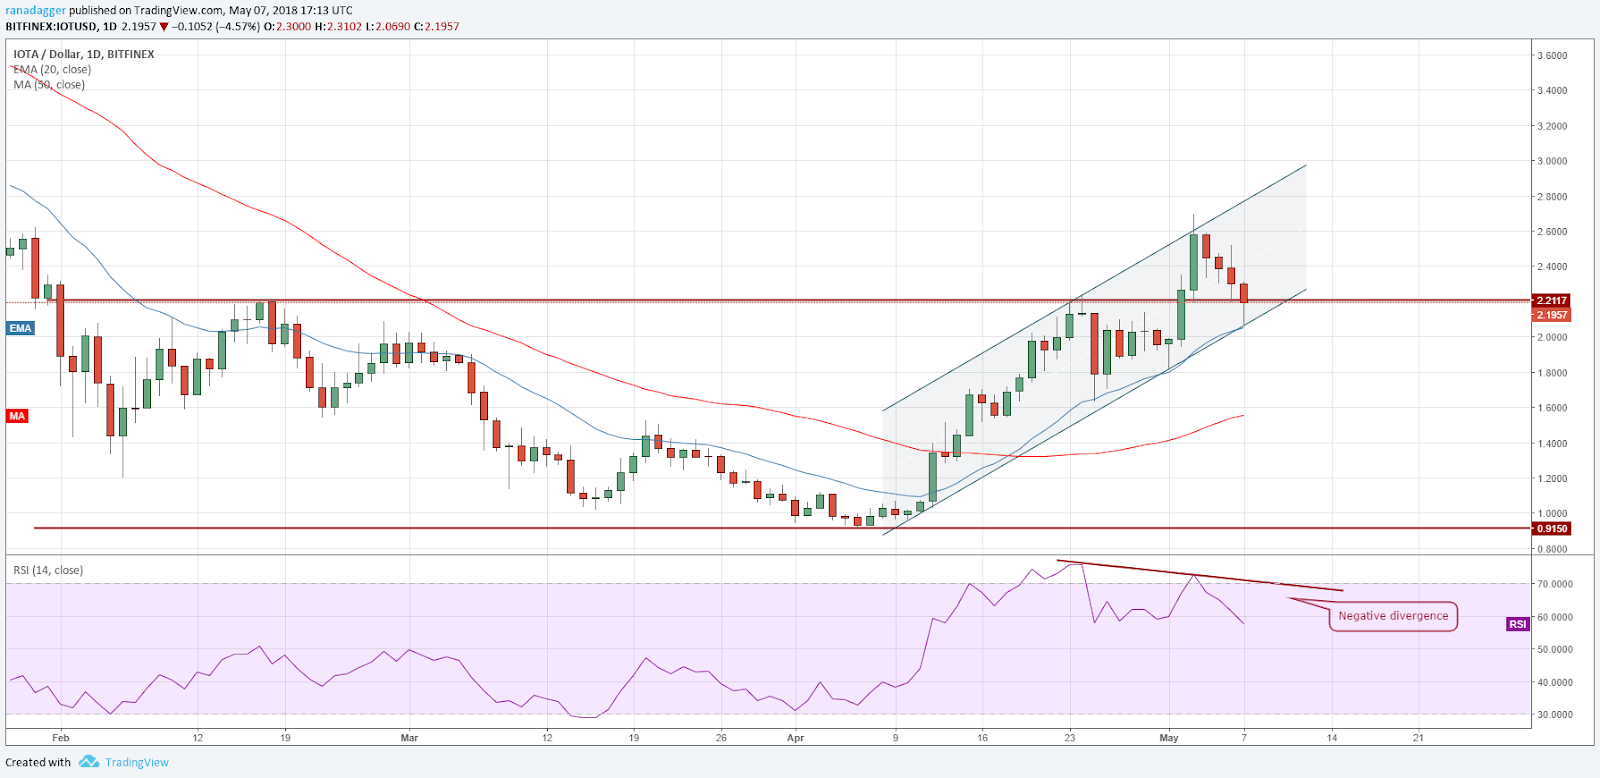
The IOTA/USD pair is currently bouncing off the 20-day EMA and the support line of the ascending channel, both of which are formidable supports. If the support holds, the digital currency will attempt to break out of $2.2117 once again.
We shall wait for the price to scale back above the overhead resistance and sustain before turning positive because we don’t like the negative divergence on the RSI.
If the support breaks, the fall can extend to the 50-day SMA.
EOS/USD
After the stupendous rally, EOS has been trading in a tight range for the past week. We have been anticipating a few days of consolidation to digest the recent gains.
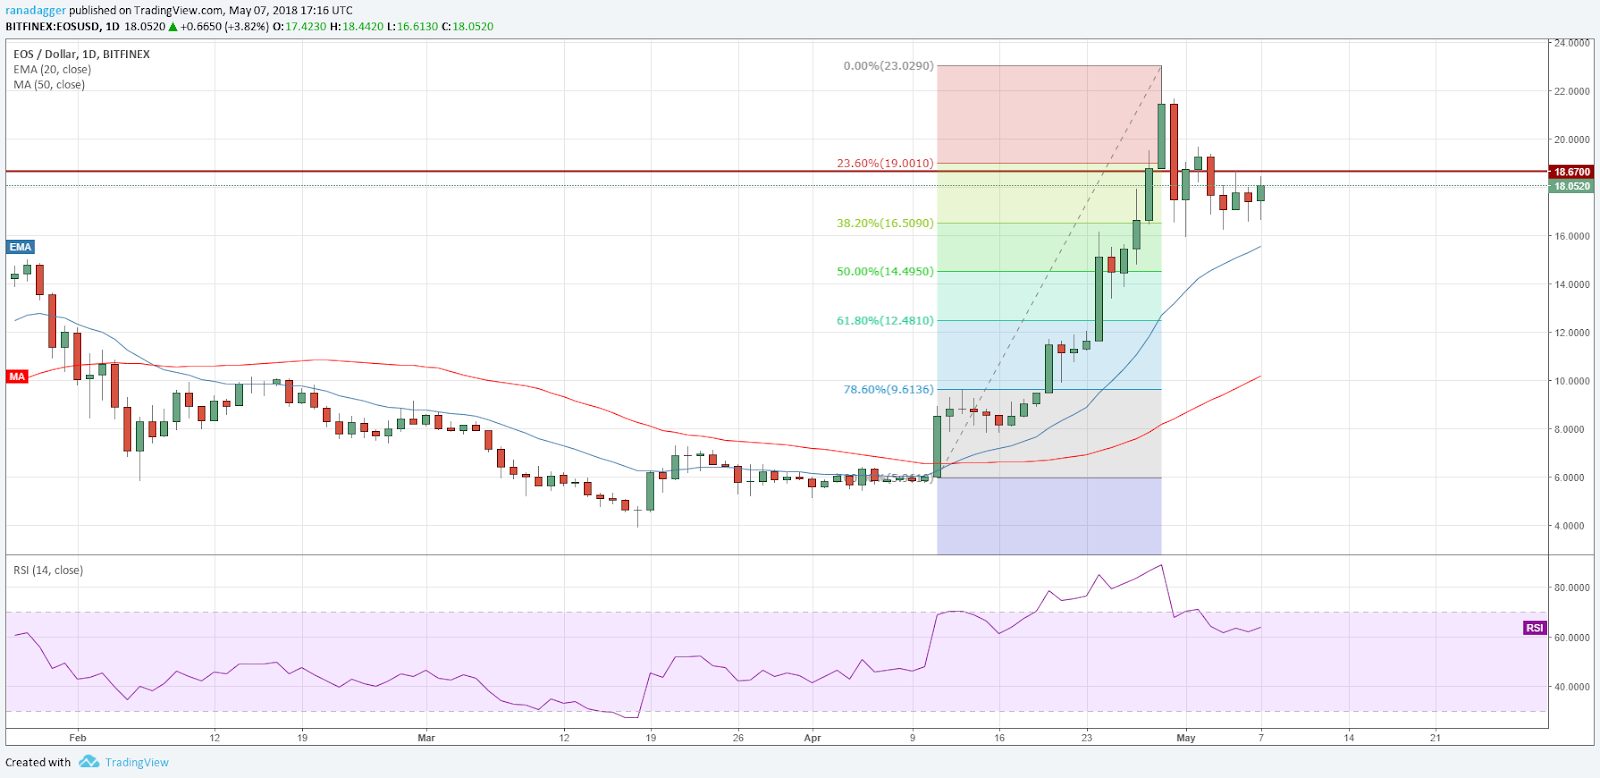
On the downside, the 38.2 percent Fibonacci retracement level of the recent rally has offered strong support. This shows that the bulls are in no hurry to book profits and are willing to buy the small dips. However, on the upside, $18.65 and $19.63 have been acting as strong resistances.
A break down below $16 can lead to a slide to $14.495 levels while a breakout of $19.63 can carry the EOS/USD pair to the lifetime highs. At the current levels, we don’t find any buy setups, hence we are not suggesting any trade on it.
The market data is provided by the HitBTC exchange. The charts for the analysis are provided by TradingView.
