The views and opinions expressed here are solely those of authors/contributors and do not necessarily reflect the views of Cointelegraph.com. Every investment and trading move involves risk, you should conduct your own research when making a decision.
Many experts have called the stupendous rally in the cryptocurrencies as a bubble. Notwithstanding, the digital currencies have continued their uptrend. However, as we know, nothing can go up for ever. Gravity will catch up and there are bound to be corrections in between, which will offer a good entry point again.
However, sometimes the corrections can be unnerving and can cause a large dent to the portfolio. So, has the time come to cash in some profits and be ready for a downturn or is this another of those consolidations that will breakout on the upside? Let’s see the charts and try to forecast.
BTC/USD
Buyers continue to support Bitcoin close to the trendline support of the ascending channel. However, bears are attempting to defend the $4695 level, which is a 61.8 percent Fibonacci retracement of the fall from the high of $4980 to the swing low of $4234.16.
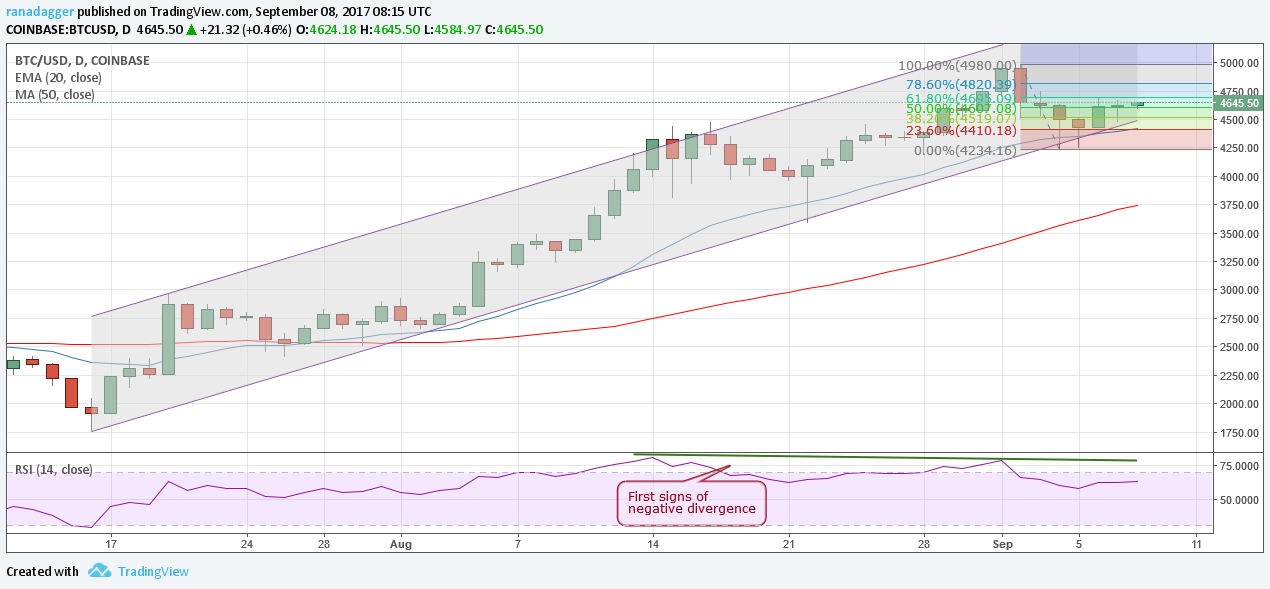
For the last three days, the digital currency has failed to breakout of the resistance. Notwithstanding, the range of the past two days has shrunk, which signals an imminent breakout or breakdown, either today or over the weekend.
If the bulls manage to breakout of $4695, a retest of the highs is likely. On the other hand, if the bears breakdown and close below $4400 levels, the uptrend will be in danger. Therefore, traders who have gone long on our previous recommendation should continue to hold with a stop loss of $4400. They should raise their stops as the digital currency moves up.
However, we continue to advise reducing allocation size to less than 50 percent of normal, as $5000 is likely to act as a strong resistance and a small correction or a range bound movement is not ruled out.
ETH/USD
Ethereum is struggling to breakout of the $341, which is the 50 percent Fibonacci retracement of the fall from $396.88 to $285. Though the bulls have managed to keep the digital currency within the ascending channel, and they have not been able to breakout of the overhead resistance.
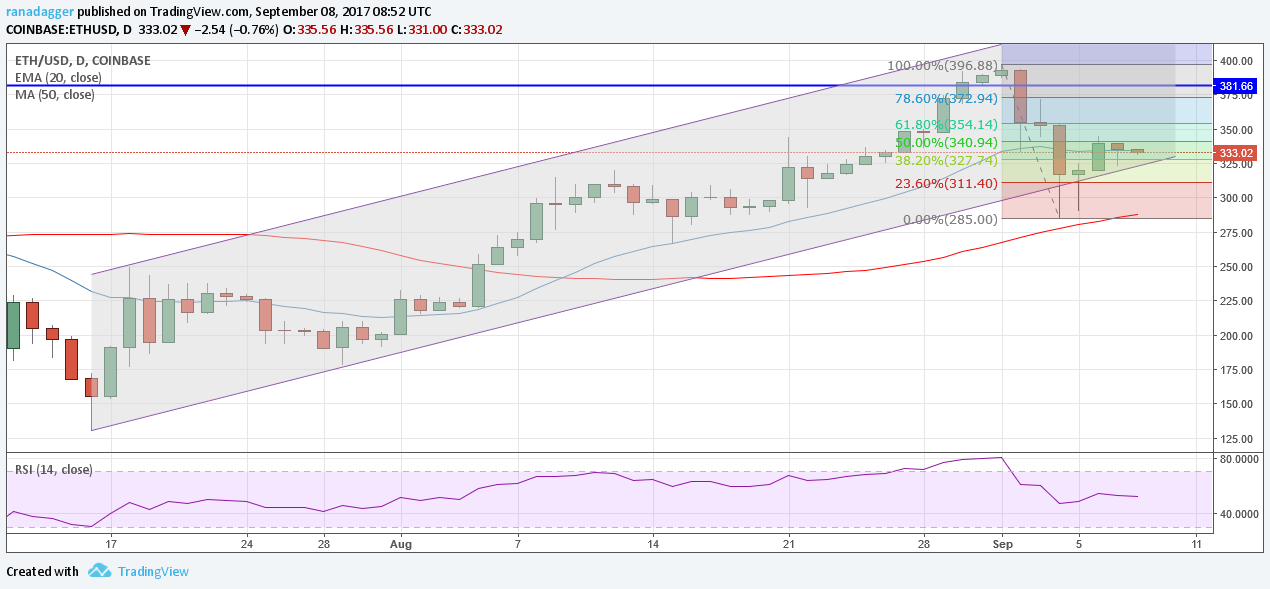
The RSI is close to the 52 level and the 20-day EMA has flattened out, indicating a range bound trading. However, if the bulls manage to breakout of $354 levels, a retest of $381 levels is likely.
On the other hand, if the bears breakdown and close below the trendline support of the digital currency, a fall towards $285 is likely. Therefore, traders who have gone long on our recommendation should maintain the stop loss at $318.
BCH/USD
Bitcoin Cash broke out of the descending channel and rallied close to the overhead resistance of $736, according to our expectation. However, we did not recommend a trade because we didn’t find any reliable buy setup.
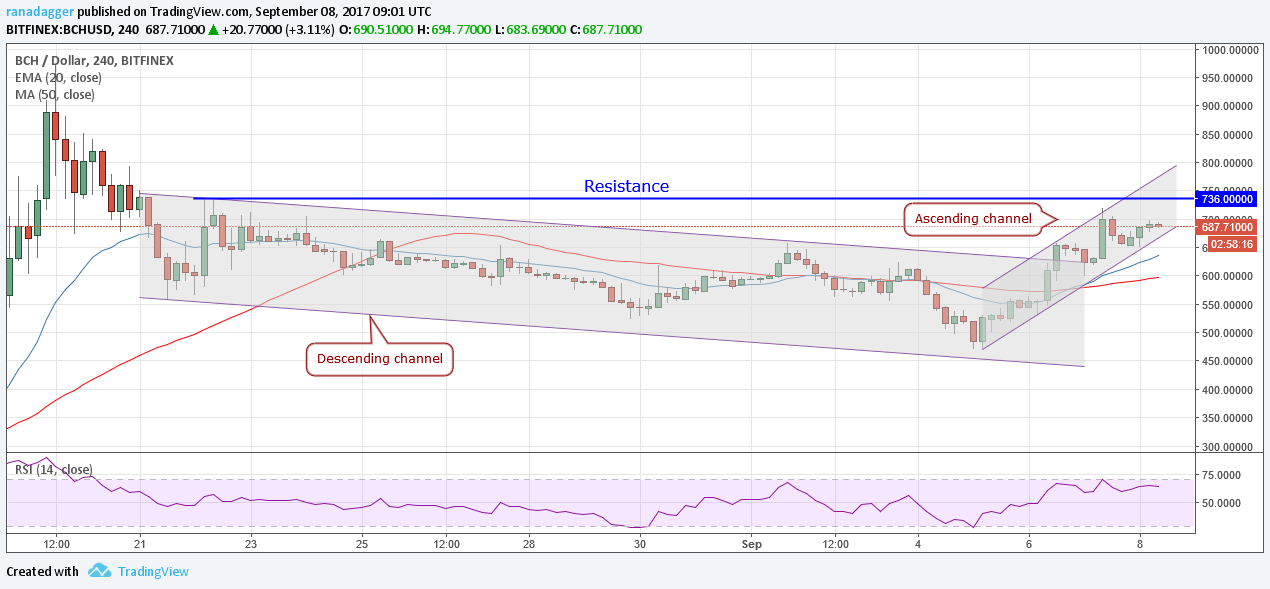
Currently, the digital currency is trading within an ascending channel. A breakdown from which will keep Bitcoin Cash range bound. The cryptocurrency will become positive only above $736.
However, we still don’t find any reliable buy setups, therefore, we remain neutral on Bitcoin Cash.
XRP/USD
Ripple has again formed a small descending triangle, which is a bearish pattern. The pattern will complete only if the digital currency breaks down of $0.19300 levels.
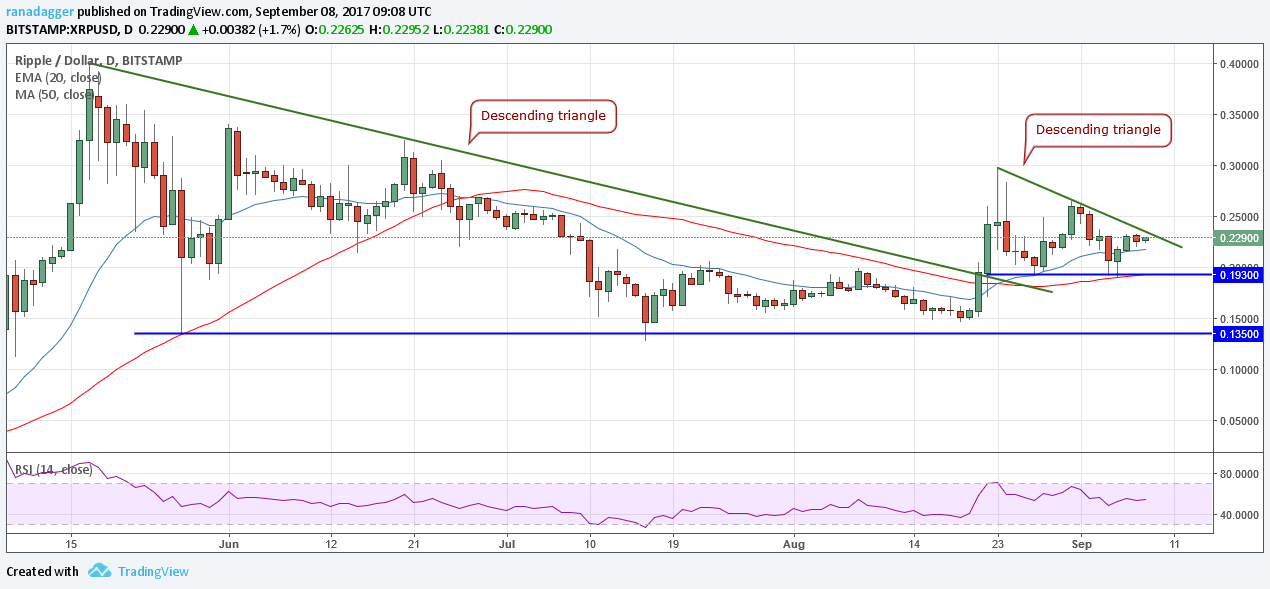
However, if price breaks out of the triangle, it invalidates the bearish setup, forcing the bears to cover up, thereby pushing prices higher. Therefore, aggressive traders can go long at $0.2400 and keep a stop loss of $0.1900. The first target is $0.3000. Traders can expect ripple to gain momentum once it sustains above $0.3000 levels. Therefore, only half position should be liquidated at the resistance and the other half should be held with a suitable stop loss.
The digital currency doesn’t have an established trend, therefore, please keep the allocation size small.
LTC/USD
Litecoin is facing resistance close to the 50 percent Fibonacci retracement levels of the fall from $98.28 to $64. However, it has made higher lows for the past three days, which shows that the bears are losing their momentum.
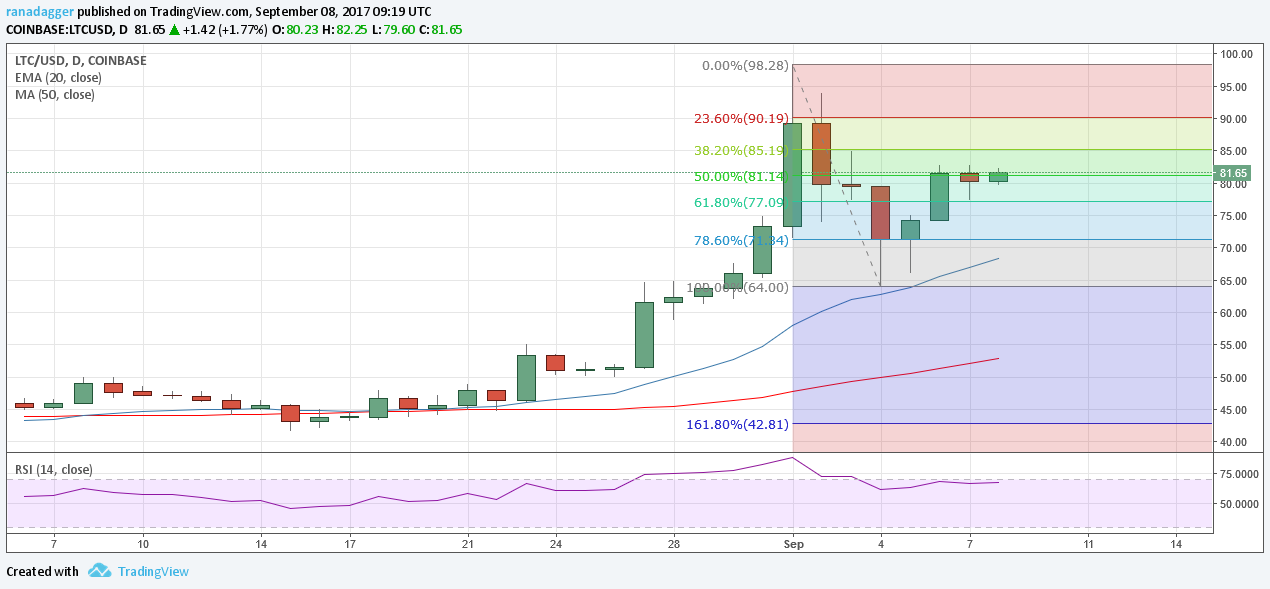
Therefore, traders can enter long positions on a breakout above $83 and keep a stop loss of $73. The target objective is a retest of the highs. After a series of large range days, we expect some kind of a consolidation to set in. Therefore, presently, we don’t expect a breakout of $100 levels. Please keep the allocation size small.
