Last Week’s Review
In last week’s post we concluded with the following statement:
We are currently Long-Term Bullish, Intermediate-Term Bearish, and Short-Term (very tentatively) Bullish. We will continue to treat the US$500 as support until visibly shown otherwise. The highest probability target is the bottom of the triangle at US$560 though some confidence has been lost in this move since last week.
If it gets us there, the situation will be re-evaluated, but the most likely outcome is some more downside back to the US$530-500 zone. Some confidence in the move lost because the longer we hang around US$500 the more likely it is to break down.
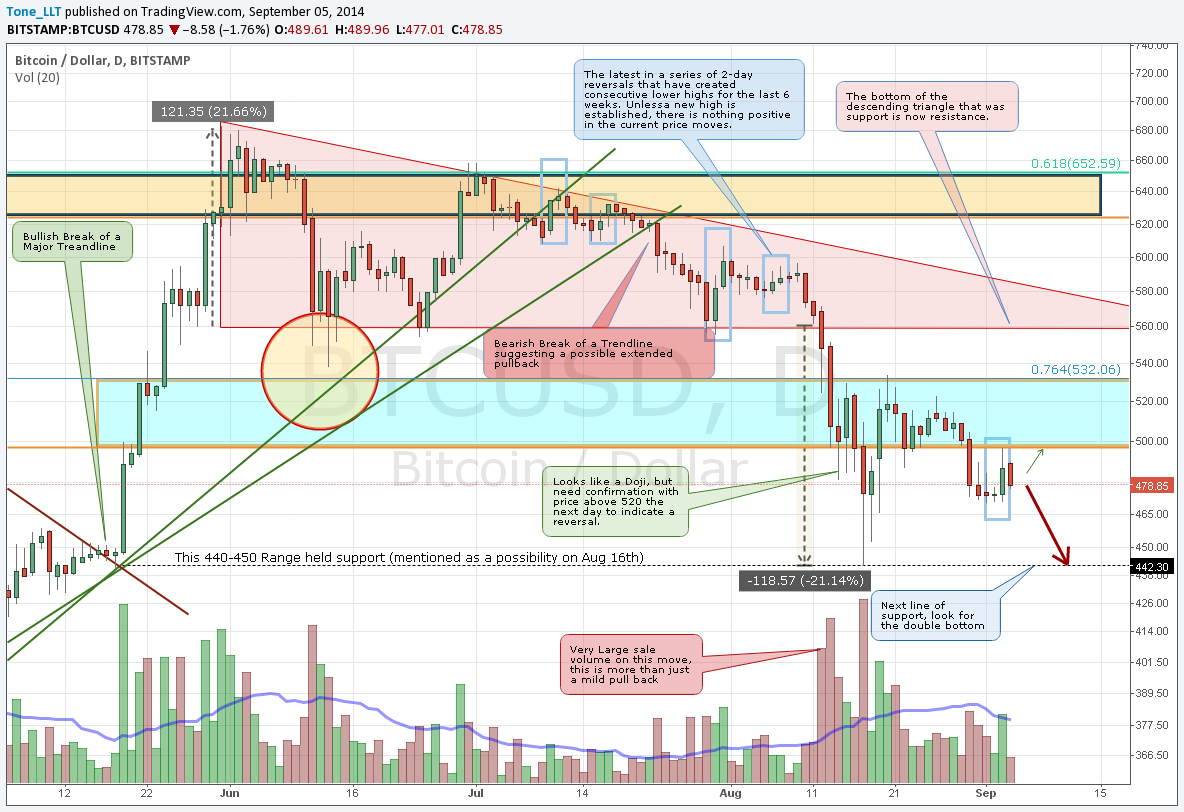
Two other scenarios are shown on the short-term chart. If US$500 cannot support the price and we fall back down, look for a double bottom back in the US$440-450 range, and if that gives way as well, we are looking at US$340-360 as next line of defense. Another less likely outcome to keep on your radar is a breakout over US$560 in which case there is some resistance at the top of a triangle at US$580 then the $630 Fibonacci line.
As you can see, we losing confidence in the US$500 holding up as support, but we could not assume it would break down. Once it did the price made it into the low US$470’s very quickly. Also please notice how a big move on September 3rd took us right back to the US$500 which validates the classic saying “what was once support is now resistance”. We do not assume things will happen, we will just look at what the charts are showing and as usual try to identify points of interest where traders will have to make tough decisions. So on that note, let’s take a look at the long term picture.

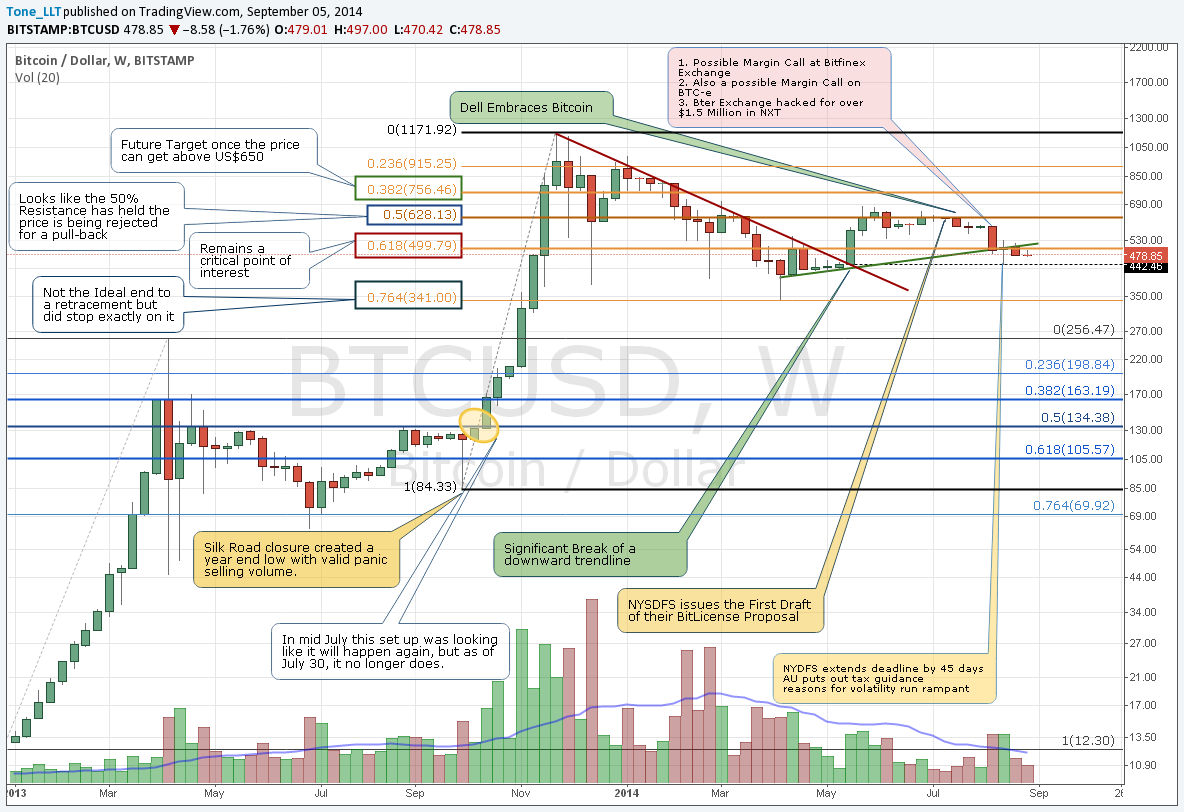
The chart remains ‘tentatively’ bullish, but there isn’t much positive to point to in this chart. We are now noticeably under an upward trending trend line, and even though we are not big fans of trend lines unless they are blatantly obvious to all technical traders, this one connects 7 weeks of weekly lows to establish a base. This chart will remain slightly bullish as long as the price can stay above the breakout low from early may which took place around US$440.
Education (Intro to Time pt. 2)
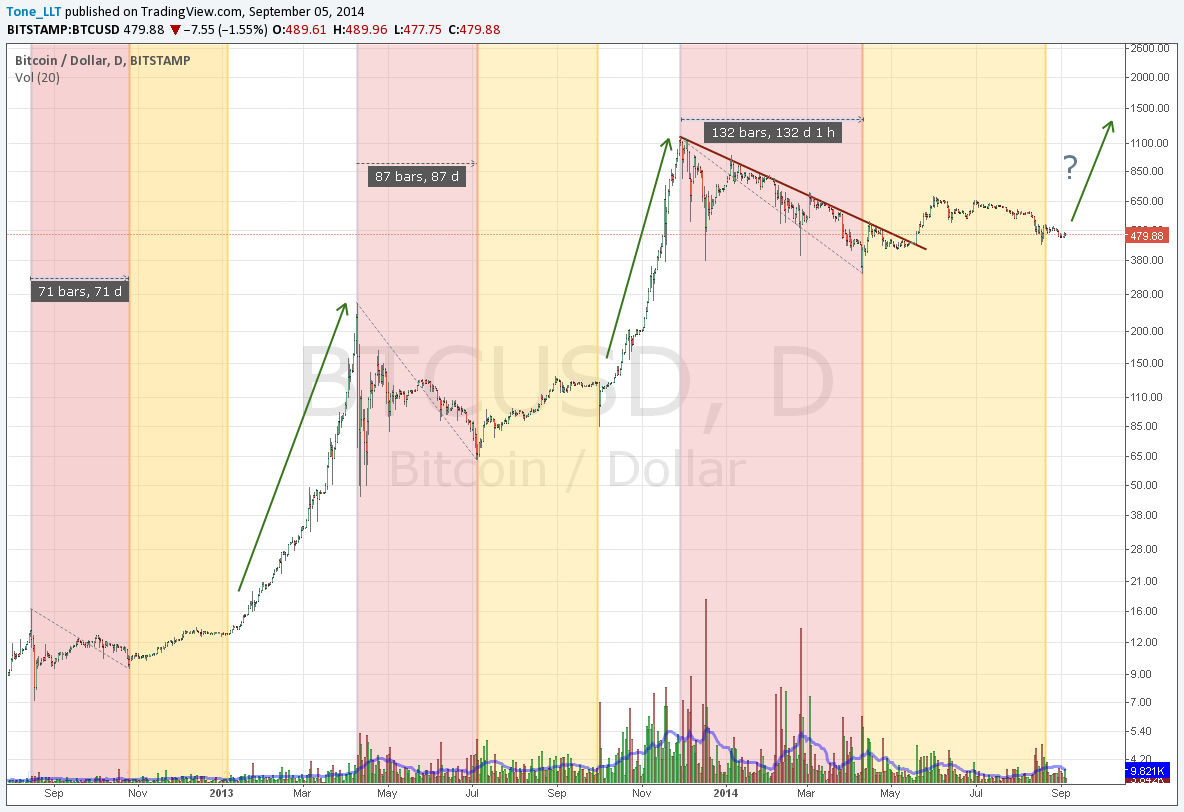
As mentioned last week, Time analysis is where a trader looks to pinpoint a move based on a point in time and not necessarily looking at price. Here is one example of such a chart and as you can see, two previous cases are being used to identify a potential move for the next up-swing. Unfortunately, if this up-wing does not begin this week we can chalk up the previous two example as coincidences.
NOTE: in the chart below the area shaded red is identical in Time to the area shaded yellow as it connects a swing high to the subsequent low.

There are many other ways to try and predict movements based on time. In the stock market for example there are popular saying like “sell in May and go away” and “the Santa Clause Rally”. The Bitcoin world is way too young for such patterns to capture people’s imaginations and perhaps become self-fulfilling prophesies. This new trading phenomenon will simply need some more ‘Time’ before it captures any catch phrases.
Fundamentals (aka News)
A good news roundup to catch up on all that was missed can be found here. Not much has happened this week, but you can’t help but feel that merchants are starting to accept the idea of Bitcoin payments faster than the consumers are adopting the concept. This of course makes perfect sense, but these merchants will need to start passing on the savings to the consumers. These savings should turn out to be significant as besides saving on credit card fees and chargebacks, many large retailers would save a lot of headaches dealing with private data breaches like Target leaned earlier this year and Home Depot in the middle of right now. It’s nice to see more people willing to accept bitcoins as their paycheck, but this clearly applies to those already familiar with crypto-currency and is not yet a sign of Mass-Adoption. This trend puts some pressure on the price of Bitcoin so we will be mindful of this trend. There are however signs for potential spread to the masses happening in South East Asia, and that is also something to keep an eye on.
Daily Overview
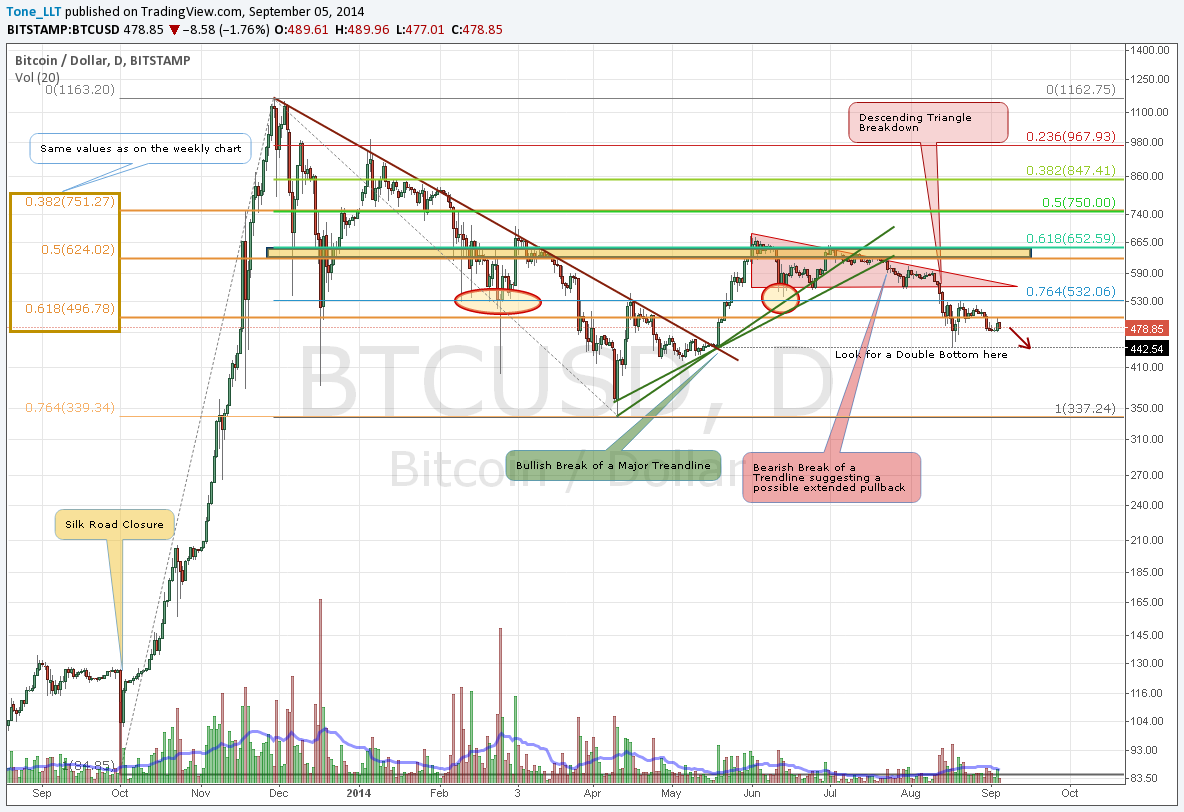
Here is our 1-year Daily chart still referencing Fibonacci Retracements and a few Trend Lines broken back in July

This is the chart we have been referring to as our ‘Intermediate’ time frame. Ever since the Descending Triangle was identified, we have considered this time frame to be bearish. At the moment there is clearly nothing positive in this chart and it will stay that way unless we can recover the US$500 mark in a quick fashion.

This is our more detailed short term chart also looked at on a Daily scale, which has been cleaned up a bit from last week. Unlike last week however, when we considered this chart to be ‘tentatively’ bullish, this week there is very little positives that we can draw from this chart. Notice the latest 2-day rebound that was rejected at what we will now call the US$500 resistance point. Also notice how the volume is still a bit weak and was not large enough to make up for the selling over the previous 3 days. If it wasn’t for the move all the way down to US$442 last month, we would say that there is another Descending Triangle in the making. These triangles do occasionally break to the upside, but the probabilities point to further downside.
Conclusion:
We are now changing our view point to Long-Term (tentatively) Bullish, Intermediate -Term Bearish, and Short-Term Bearish. Unless we see some positive signs we are now focused on the possible Double Bottom target of US$440-450 zone. If that can hold, there might be some signs of a healthy recovery. If not, the next step down will be all the way to the US$360-380 zone but we will analyze that possibility in due time.
As always we provide potential less-likely outcomes so that the reader can consider all options. Price can obviously reverse at any moment with or without a news event so in case it does, watch the US$500 resistance level which has already proven its relevance on Sep 3rd. If that mark can be broken in quick fashion there is plenty of technical resistance right above it, starting with US$530 (Fibonacci), US$560-580 (Descending Triangle), US$630-650 (Fibonacci)
Reference Point: 4:30pm ET, Bitstamp Price US$480
About the author
Tone Vays is a 10 year veteran of Wall Street working for the likes of JP Morgan Chase and Bear Sterns within their Asset Management divisions. Trading experience includes Equities, Options, Futures and more recently Crypto-Currencies. He is a Bitcoin believer who frequently helps run the live exchange (Satoshi Square) at the NYC Bitcoin Center and more recently started speaking at Bitcoin Conferences world wide. He also runs his own personal blog called LibertyLifeTrail.
Disclaimer: Articles regarding the potential movement in crypto-currency prices are not to be treated as trading advice. Neither Cointelegraph nor the Author assumes responsibility for any trade losses as the final decision on trade execution lies with the reader. Always remember that only those in possession of the private keys are in control of the money.
Did you enjoy this article? You may also be interested in reading these ones:
Coin HR - the best way to find a perfect bitcoin job or an applicant for your vacancy. We connect talent with opportunity!
