Altcoins are in a downward trend. How strong is that trend, and for how long will the fall continue?
At which levels are the current trends most likely to change?
ETH/USD
Ethereum’s price has went along the downward scenario and formed the third wave of decline. The key level for that scenario was at $10.3.
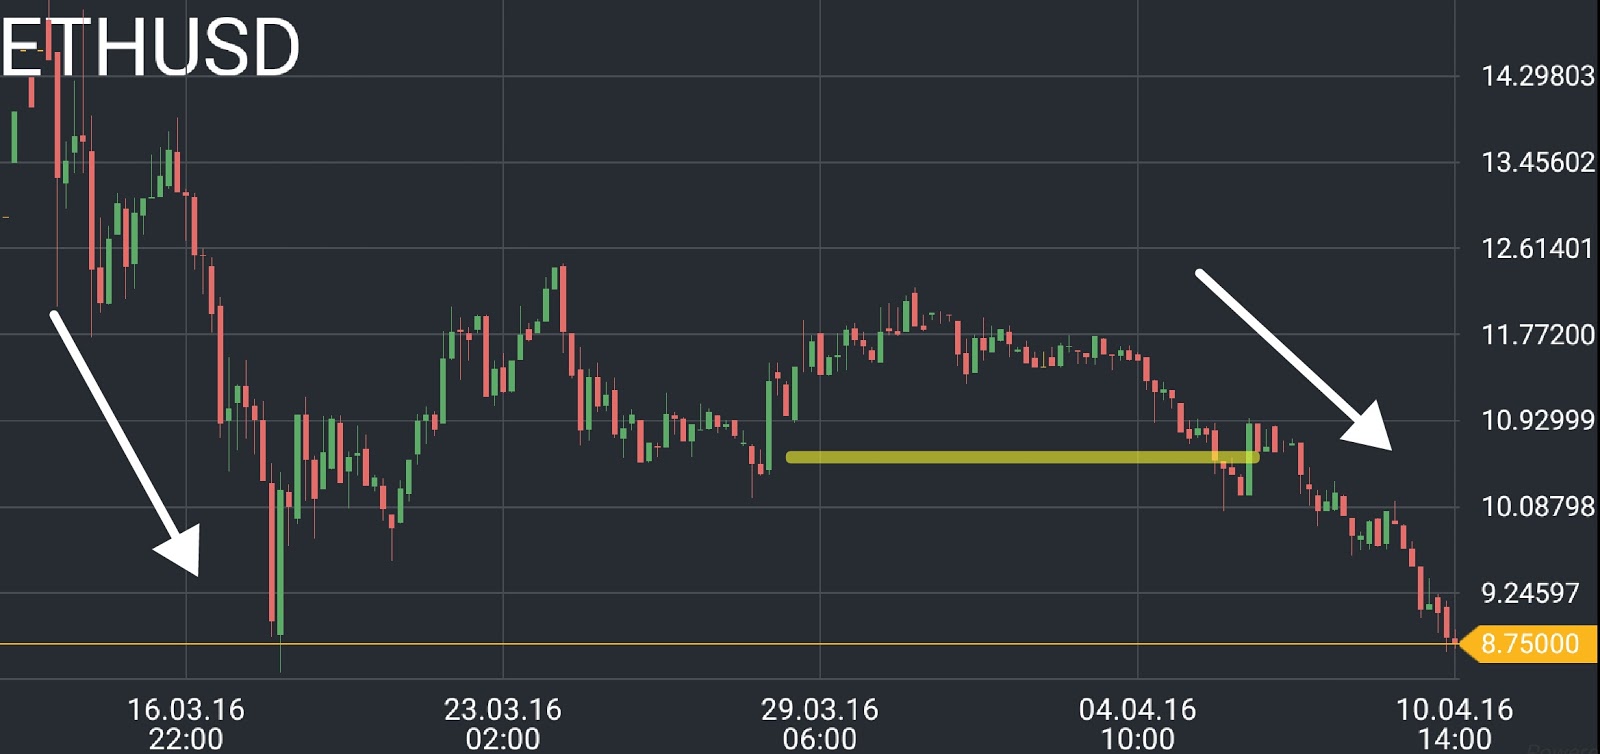
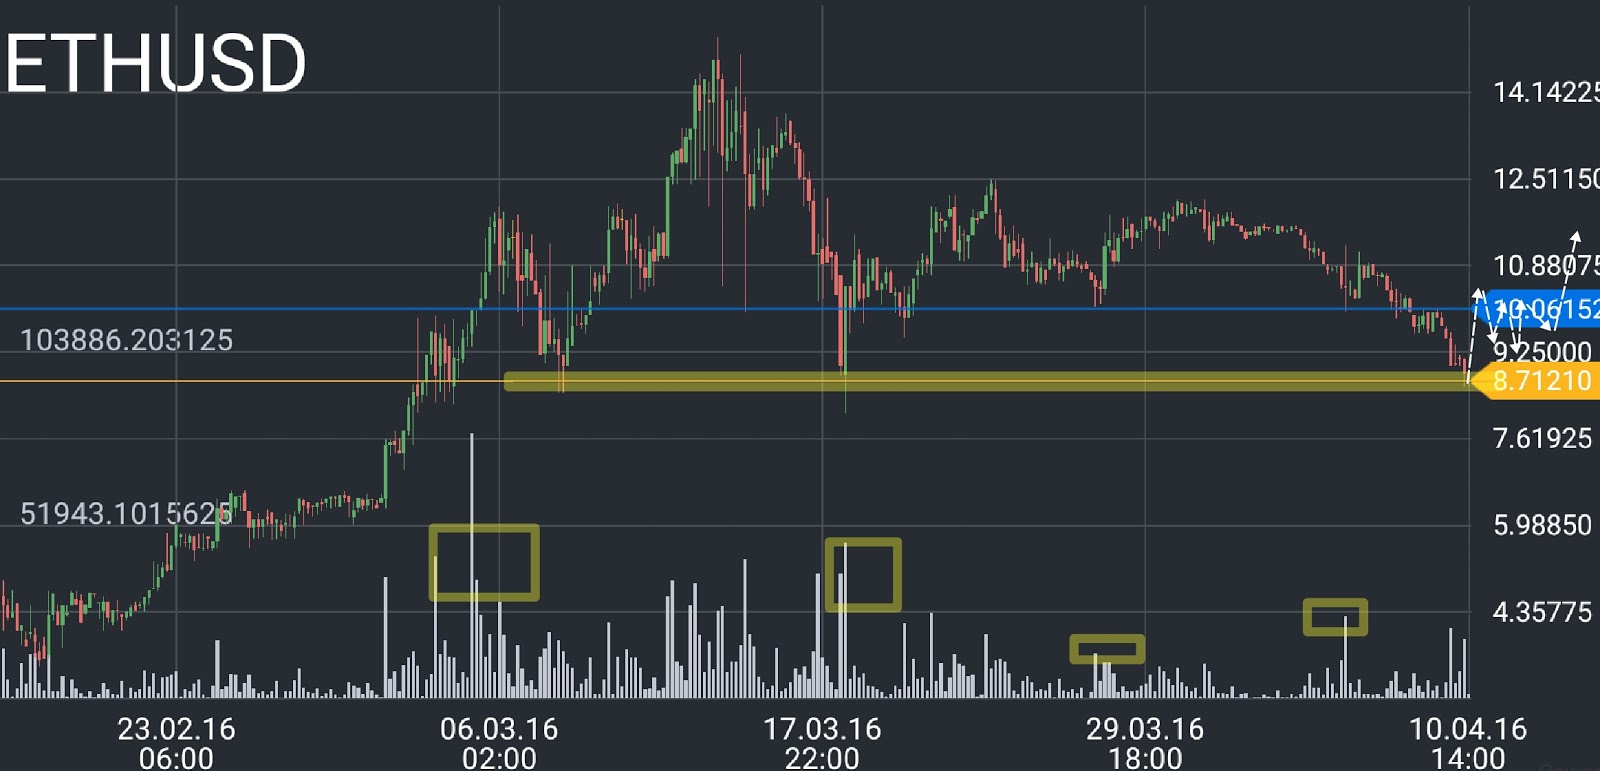
Ethereum’s price is at a key long-term resistance line, where rebounds usually happen. The critical level for a rebound is the line with the largest accumulated trading volume, somewhere around $10. If the coin’s price manages to fortify at that level and form a turn to growth, there will be a good probability for the start of a new medium-term trend with the minimal target of $11-12.
LTC/USD
Litecoin’s price has been undergoing a medium-term downward correction so far. The price is currently at the peak of that correction. This is indicated by the large volumes at the level where the price is holding right now.
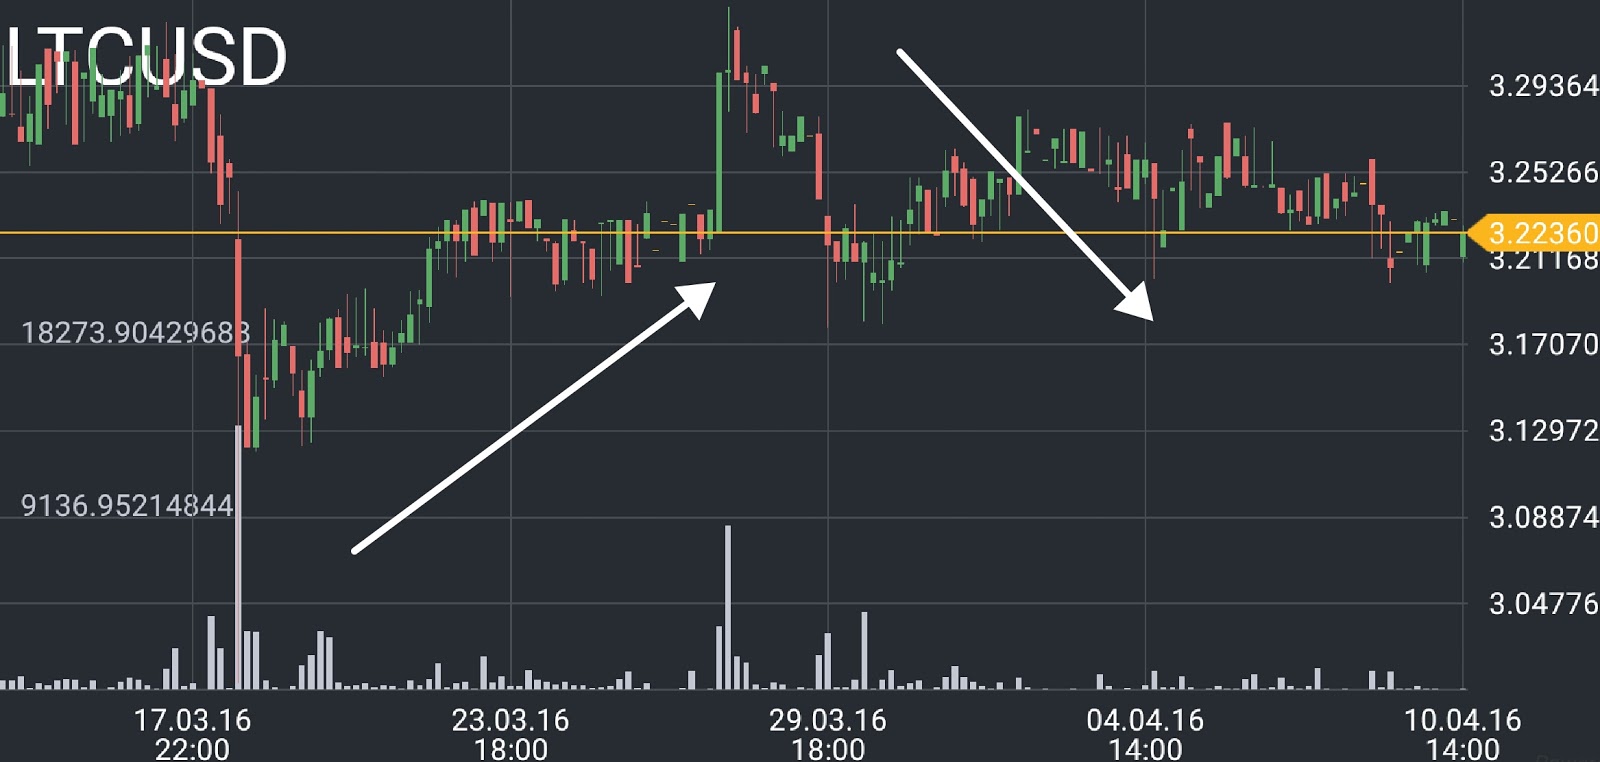
The correction can evolve into a downward trend. For that to happen, the current trend must continue. The critical level for that scenario is at $3.25. That is the largest level by trading volume and it is profitable for the bears. If the bears fail to hold that level, it will indicate the start of the third wave of growth.

DASH/USD
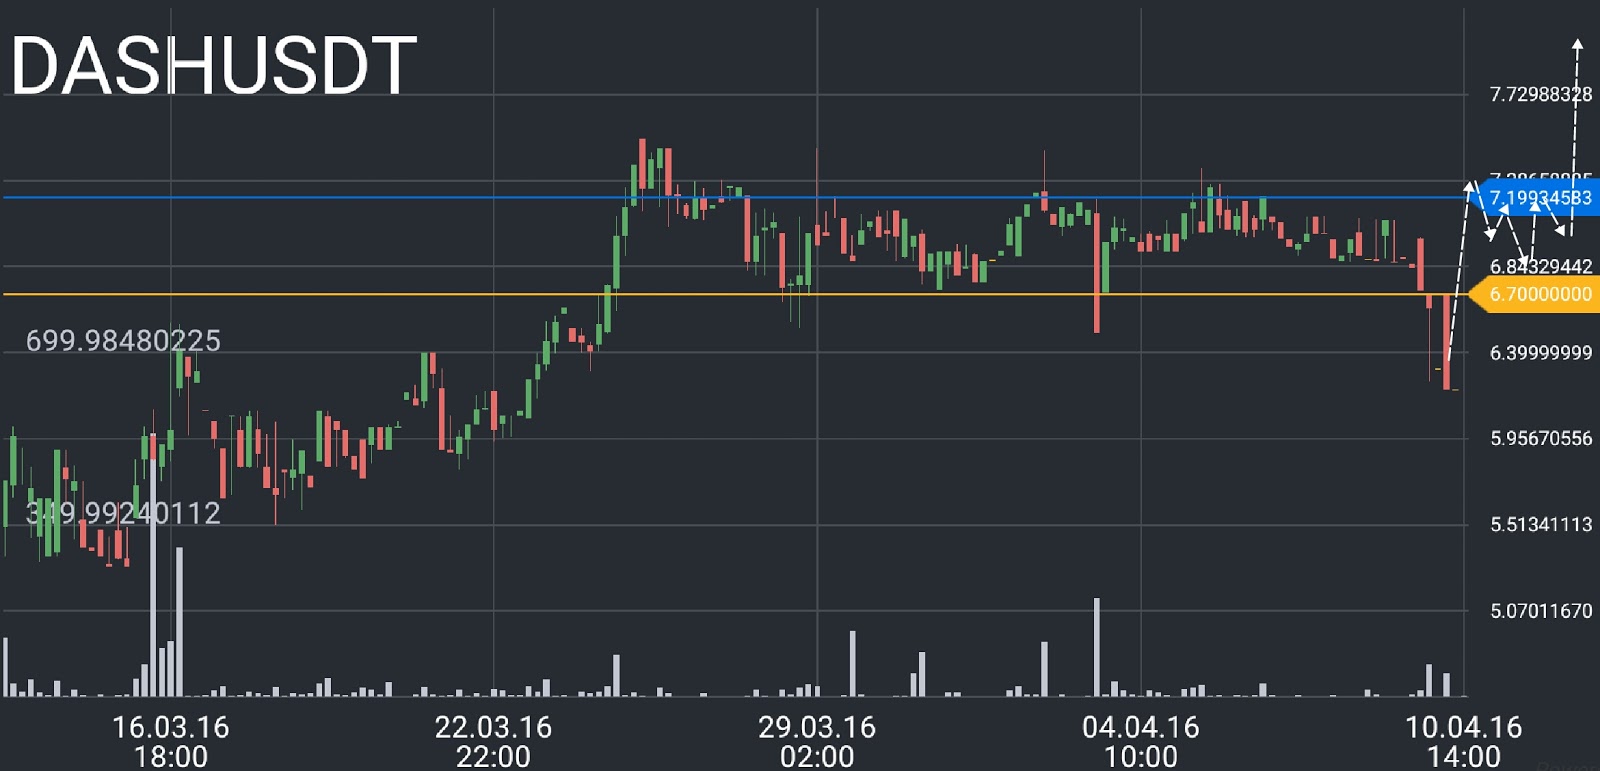
Dash’s price continues to form the long-term downward correction. Because it’s a correction, the market is moving in a flat manner, bouncing off key levels.
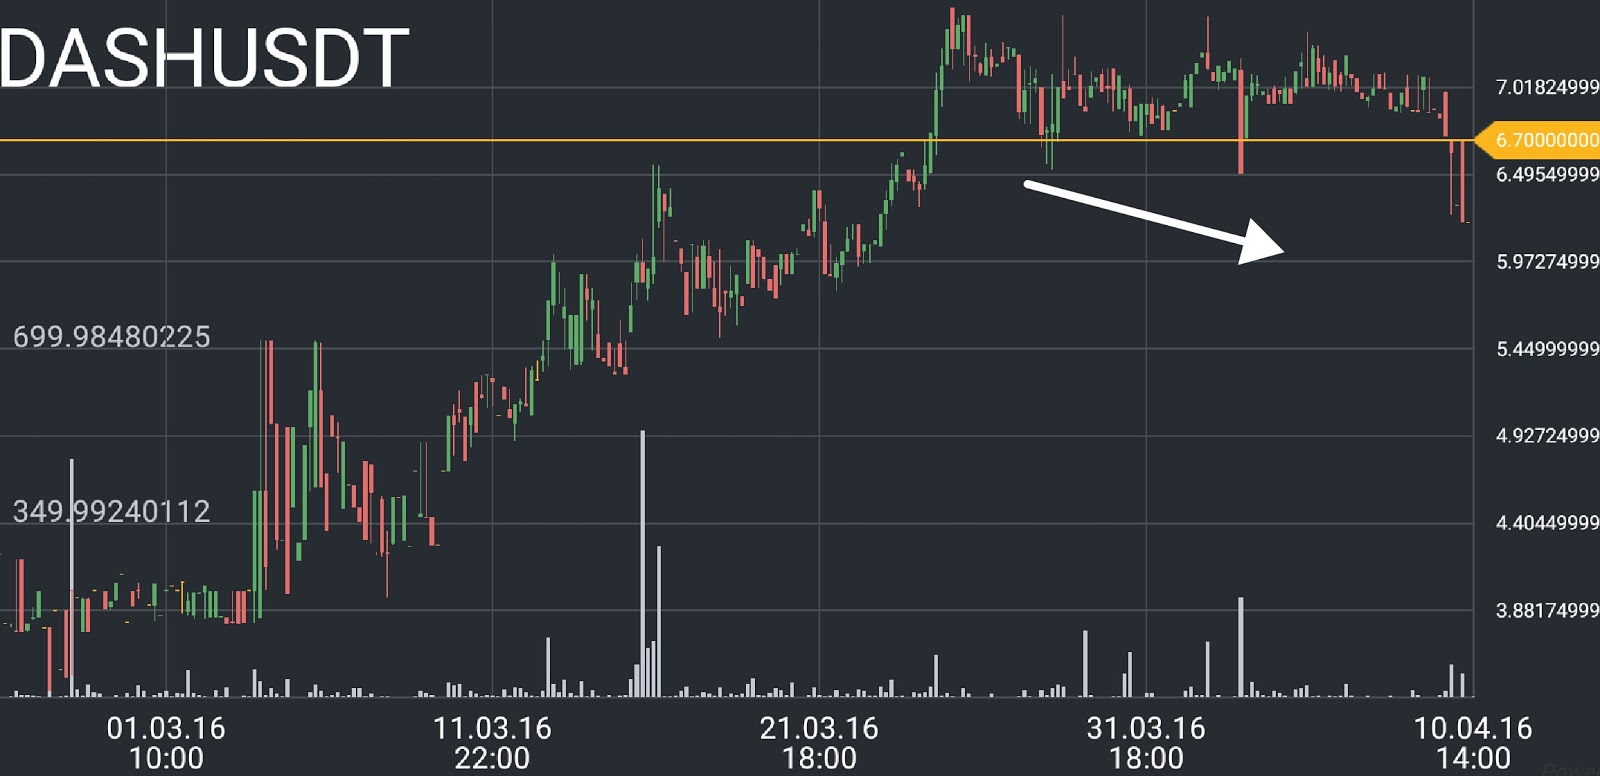
Thus, for this flat to end, Dash’s price has to fortify at the key level of $7.2. That will indicate the bulls’ advantage. In that case, the most likely scenario is the continuation of the upward trend.
Hence, the probable reversal points for the current downward trends on altcoin markets are:
- $10 for ETHUSD
- $3.25 for LTCUSD
- $7.2 for DASHUSD
