Altcoin prices have failed to display a certain growth this week. Will this mean an end to the upward trends and the beginning of downward ones? Which are the key points for a turn to decline?
ETH/USD
Ethereum’s price has not formed a turn to growth. The bulls have failed to win the advantage while the price was at a key level.
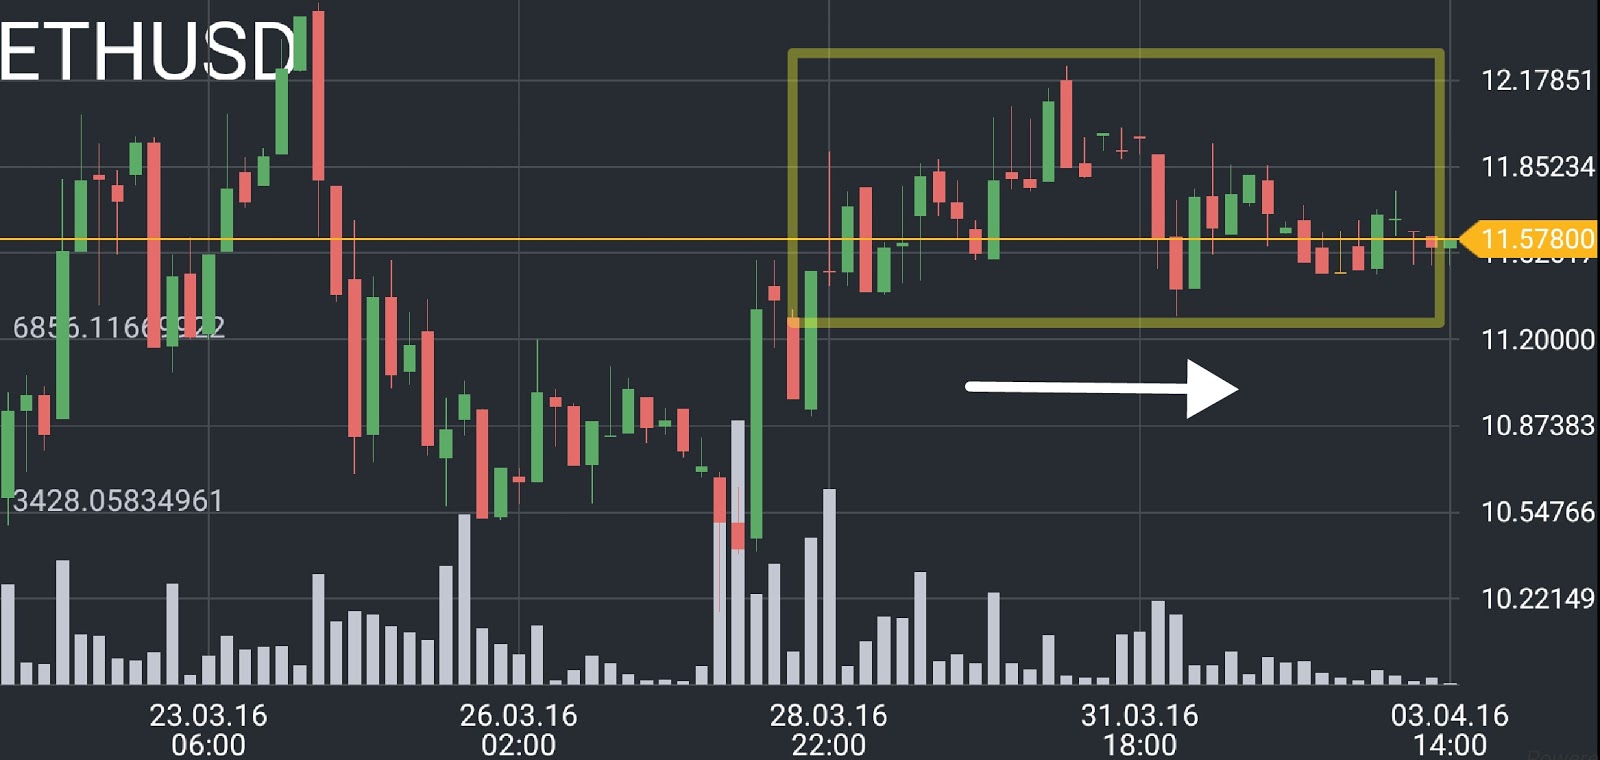
It’s either that, or there was just not enough demand among the buyers.
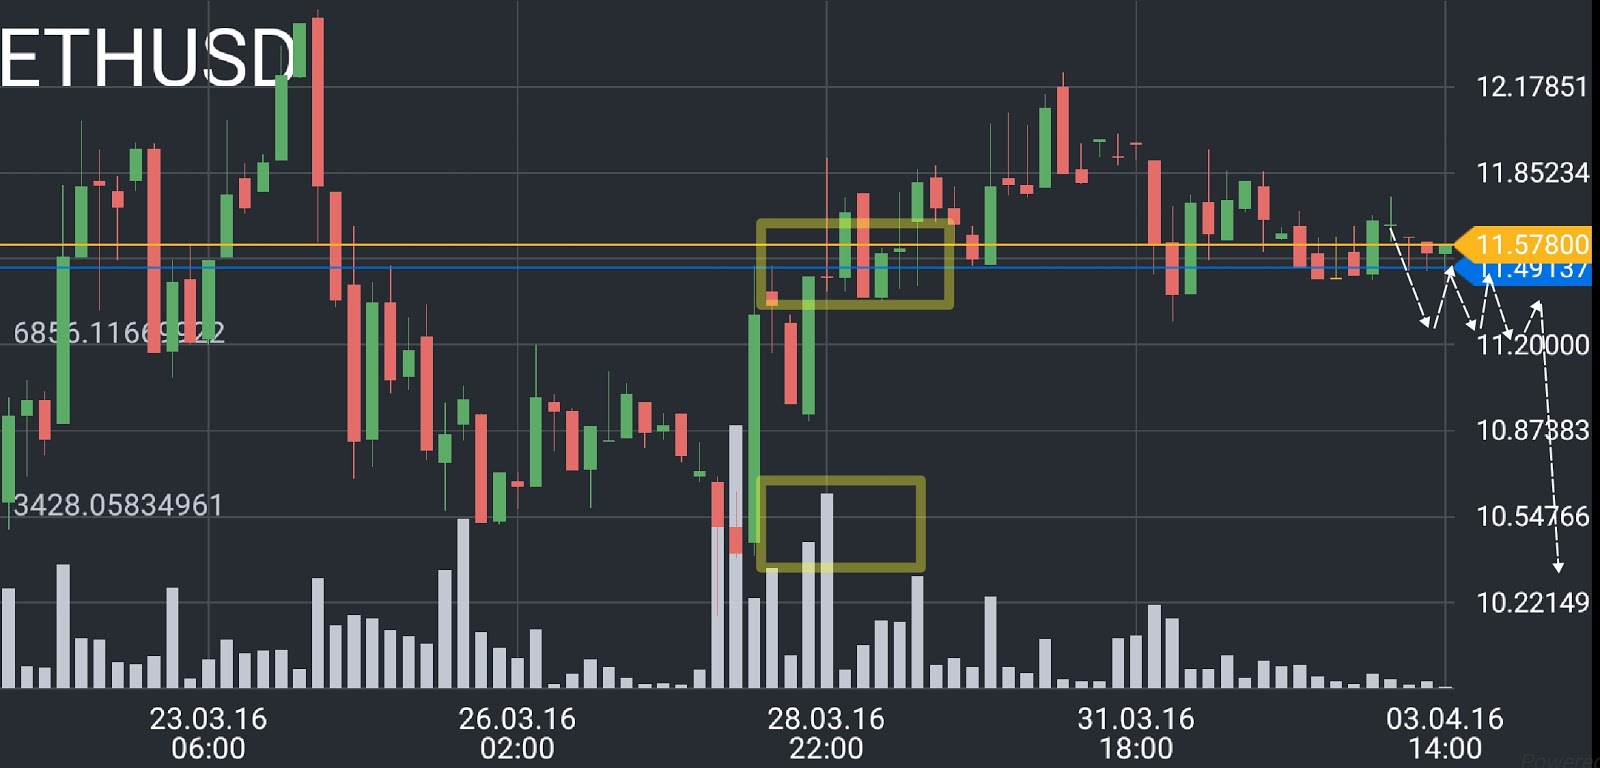
Worth noting is the level of $11.5. It’s the most likely point for a turn to decline with the closest target of $10.3.
LTC/USD
Litecoin’s price has undergone an upward trend, but failed to hold it for long.
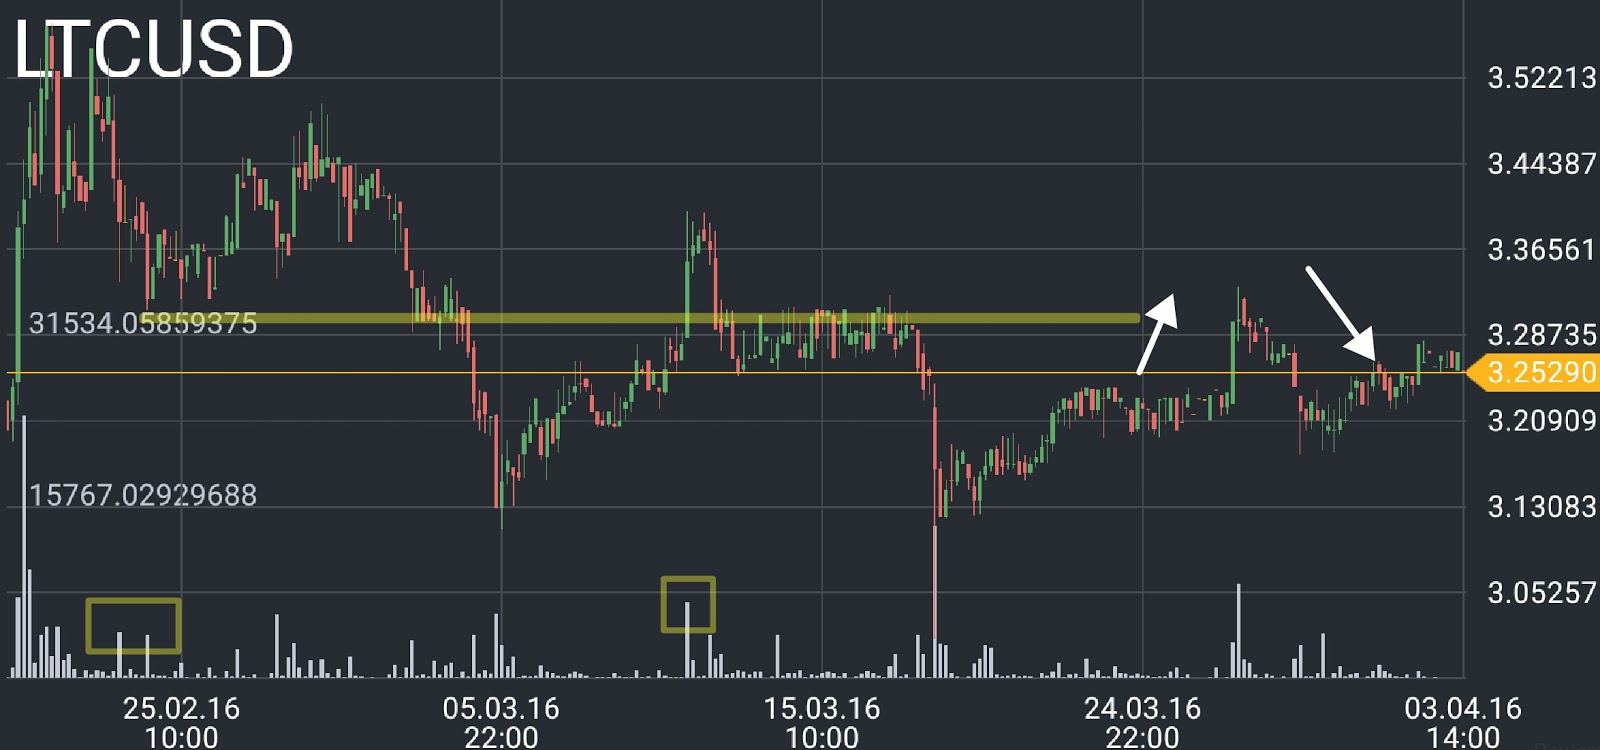
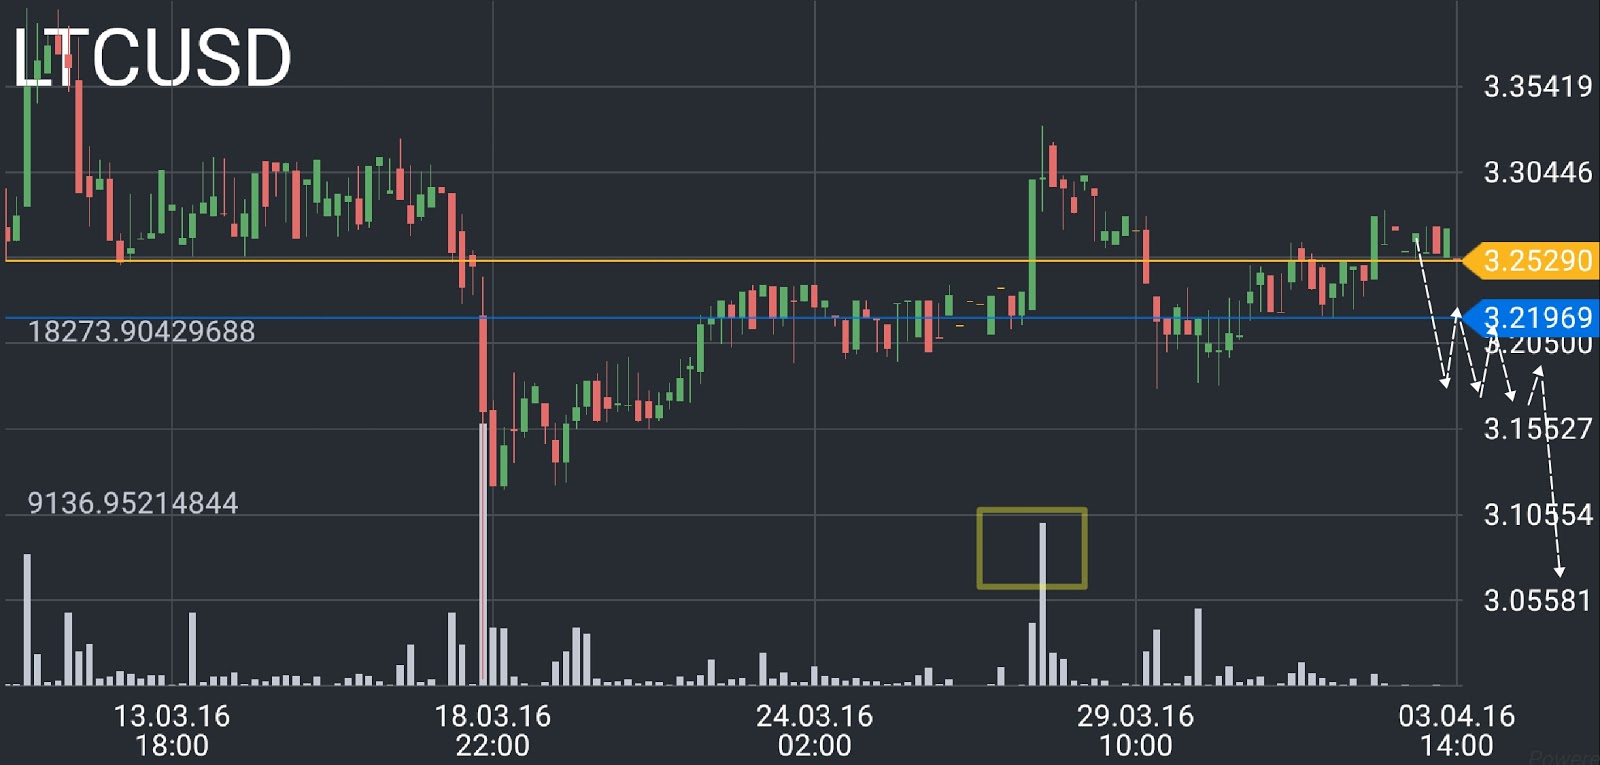
The lack of demand and uncertainty in Litecoin’s further growth - all that can provoke a drop. But to have a specific confirmation of that, one should look at the market’s reaction at a key level of $3.2, which is a convergence point for large trading volumes. After breaking through this resistance, the price will likely continue falling toward $3.
DASH/USD
Dash’s price continues to form a correction toward the long-term upward trend.
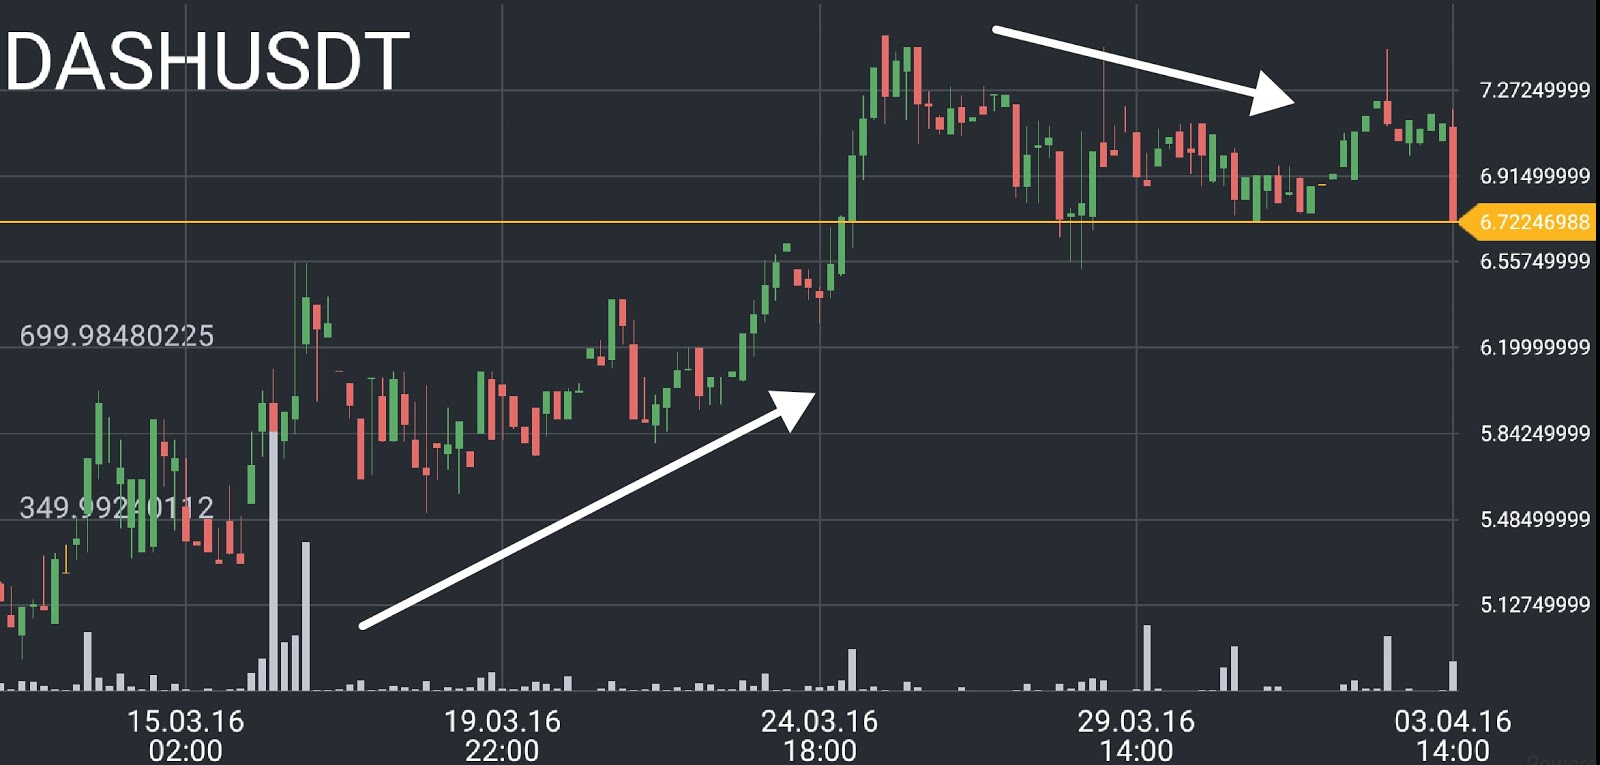
Considering the whole picture of decline across altcoins, one can expect a similar turn on DASHUSD.
The level, which is protecting the current upward trend is at around $6.7. If the market fortifies at it, a larger downward trend is likely to form and keep falling to the point of $5.8.
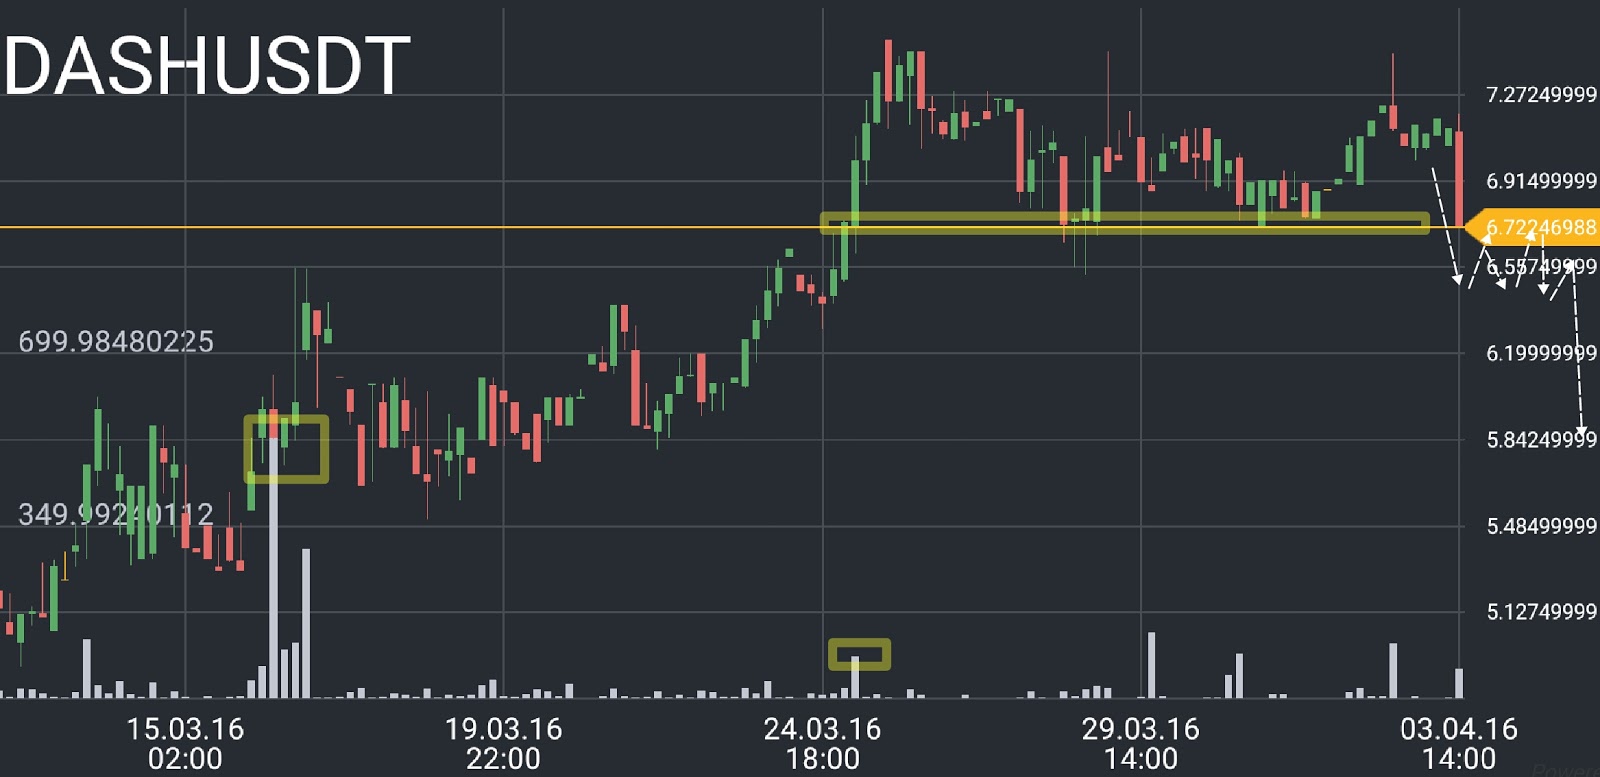
Current levels, protecting the altcoins’ upward trends are:
- $11.5 on ETHUSD
- $3.2 on LTCUSD
- $6.7 on DASHUSD
A turn to decline is most likely at every one of these points, provided the prices fortify at them. But as long as these levels are not broken through, the current upward trend will hold.
